- Space- and air-borne radar remote sensing
- Multitemporal InSAR methods
- Inverse theory
- Numerical and analytical modeling of seismic and aseismic faulting processes
- Volcanic source modeling
- Groundwater hydro-geodesy
- Sea level rise
- Landslide
- Induced seismicity
Active/Completed Projects
- Remote sensing
of water mass budget variations in California.[Collaborative project:
Prof.Werth (PI-ASU), Prof. Shirzaei (CoI-ASU), Prof. Fu (CoI-BGSU)]
- Remote sensing of land subsidence and hydrological properties across Arizona. [NESSF fellowship, M. Miller]
- Understanding and Predicting Coastal Sea Level Variability Around the United States. [Collaborative project: Prof. Shirzaei (PI-ASU), Dr. Argus (CoI-JPL), Prof. Chambers (CoI-USF)]
- Mechanism of slow slip events on San Andreas fault: constraints from geodesy and seismology. [NESSF fellowship, M. Khoshmanesh]
- Physics-based Operational Induced Earthquake Forecasting:
Process Understanding and Hazards Mitigation. [Collaborative project: Prof. Shirzaei (PI), Prof. Manga (CoI-UCB)]
- Time-dependent creep model of the central creeping
section of the San Andreas Fault from 21 years of InSAR, GPS and repeating
earthquakes. [Prof. Shirzaei (PI)]
- Origin of hydrologic responses to earthquakes: constraints from New Zealand, Taiwan, Chile, and the USA. [Collaborative project: Prof. Manga (PI-UCB), Prof. Shirzaei (CoI-ASU)]
- Observations, Models and Mechanism of Spatiotemporal Interseismic Fault Creep in California. [Collaborative project: Prof. Shirzaei (PI-ASU), Dr. Taira (CoI-UCB), Dr. Thomas (CoI-UO)]
- Application of InSAR and modeling to investigate time-dependent seismic hazard associated with waste water injection. [Dr. Shirzaei (PI)]
 |
Data
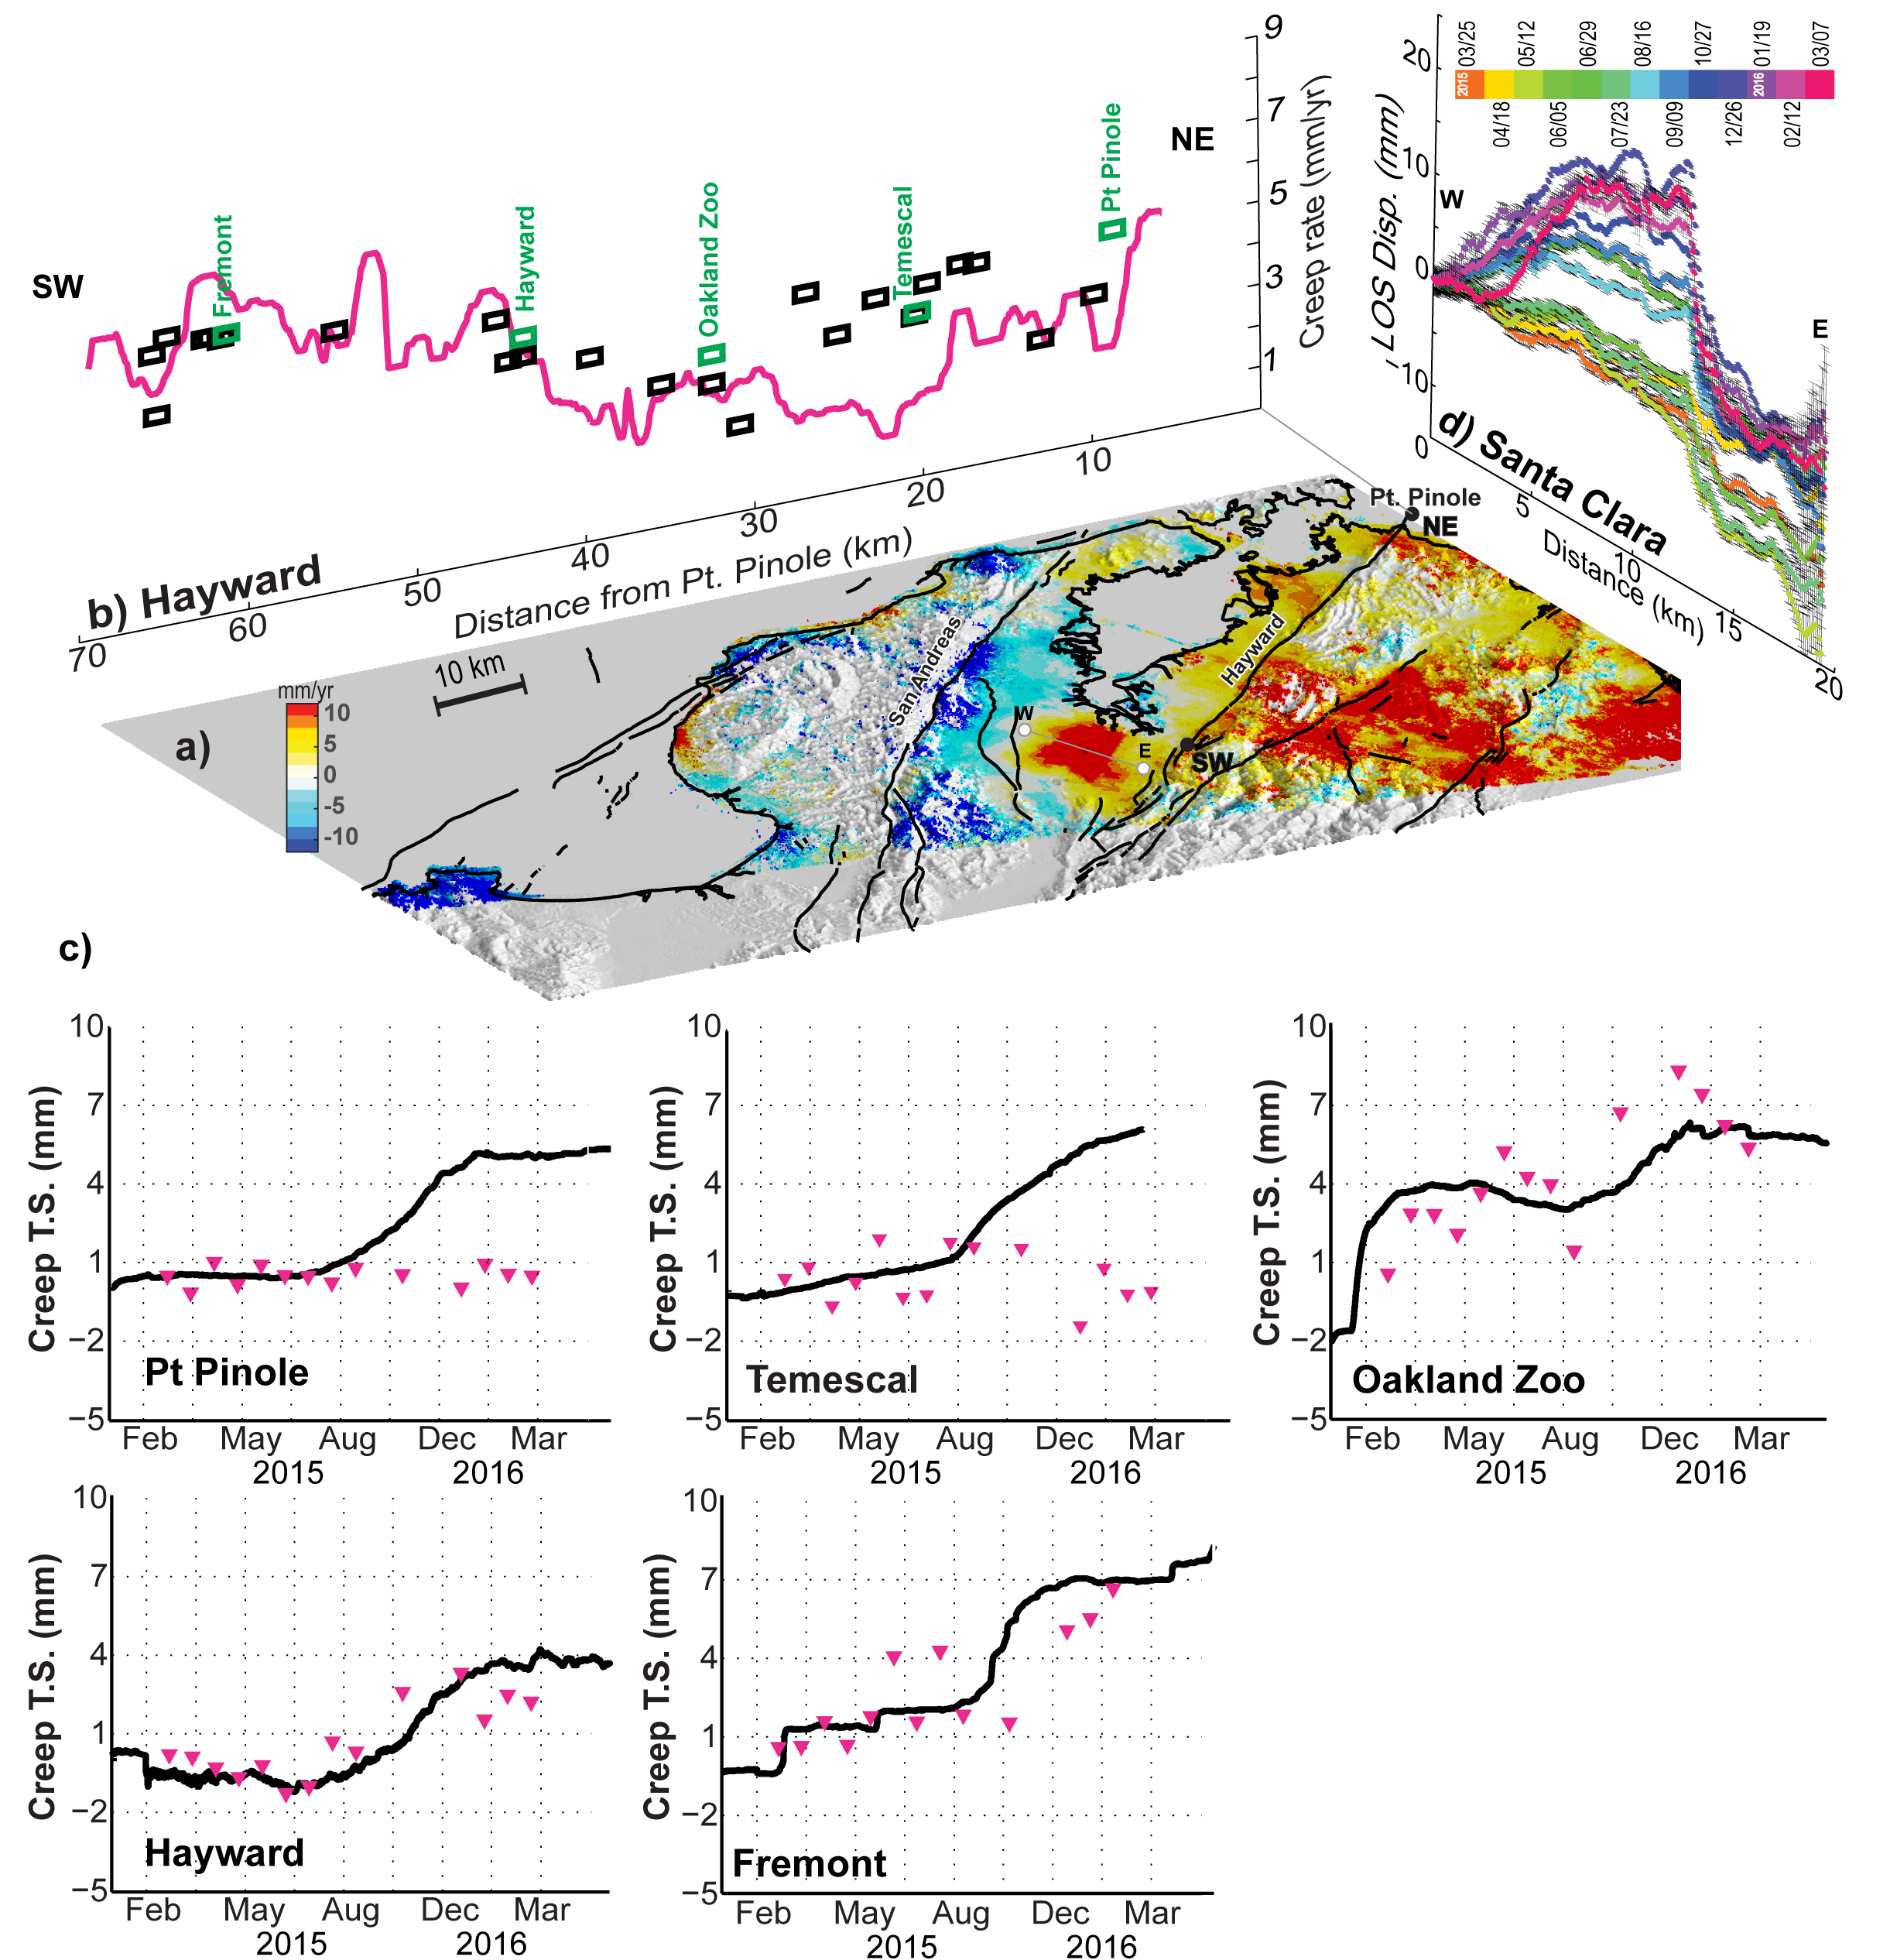
from the Sentinel-1 synthetic aperture
radar has already proven useful for investigating seismic and volcanic events since
its launch on April 2014. The requirement of ultrahigh coregistration accuracy
and the relatively short time of Sentinel-1 acquisitions make its application remain
challenging for studying slow deformation processes, such as fault creep and land
subsidence. Here, we advanced a multitemporal algorithm to analyze a set of 14
SAR images over the San Francisco Bay Area spanning 2015/03/01 to 2016/03/07.
We applied an Enhanced Spectral Diversity algorithm to achieve the required
coregistration accuracy. We obtain good interferometric coherence and find that
the coregistration error is weakly correlated with the interferometric
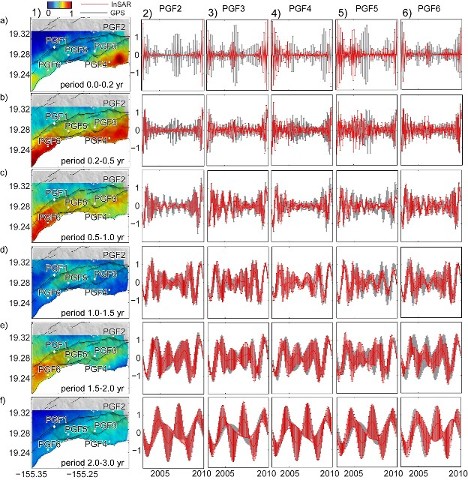
baselines. Following a thorough validation test, we used this data set to update
our estimates of Hayward Fault creep rate, characterize subsidence along Bay
Area coastlines and confirm recharge of the Santa Clara Valley aquifer system
following an unprecedented 3-year drought. [Shirzaei et al. 2017 GRL]
|
|
|
Wavelet-based InSAR (WabInSAR) time series
algorithm uses an improved filtering scheme that
combines and inverts a large set of unwrapped interferograms to generate an
accurate time series of the surface motion. This approach applies
a variety of sophisticated wavelet based filters to estimate the
interferometric phase noise and to reduce the effects of systematic and random artefacts,
such as spatially correlated and temporal uncorrelated components of the atmospheric
delay, and the digital elevation model and orbital errors. [Shirzaei 2013 JGR] |
 |
SAR satellites revisit the overlap zones of their adjacent tracks about twice as frequently than elsewhere. Due to datum and geometric differences between adjacent tracks and environmental artifacts, the task of combining these data sets is not trivial. A new physics-based approach is developed to unify the datums. The error due to the look angle difference is estimated and removed using a Kalman filter. The error associated with the atmospheric delay is reduced by applying wavelet based filters. [Shirzaei 2015 G3] |
 |
Atmospheric delay is one of the major sources of error in repeat pass interferometry. A new approach is developed for correcting the topography-correlated components of this artifact. We use multiresolution wavelet analysis to identify the components of the unwrapped interferogram that correlate with topography. By using a forward wavelet transform we break down the digital elevation model and the unwrapped interferogram into their building blocks based on their frequency properties. [Shirzaei & Burgmann 2012 GRL] |
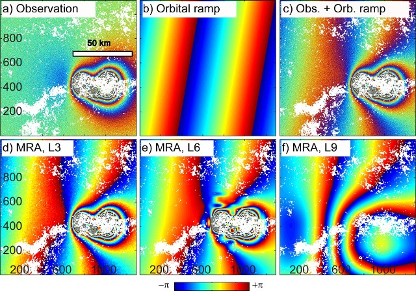 |
InSAR data
are often obtained on the basis of repeated satellite acquisitions. Errors in the
satellite orbit determination, however, propagate to the data analysis and may
even entirely obscure the interpretation. In this work, wavelet multi-resolution
analysis is employed to distinguish between the effects of orbital errors and
other components (e.g., deformation signal). Next, a robust regression approach is applied to
estimate the effect of orbit errors as a ramp. [Shirzaei & Walter 2011 IEEE]
|
|
|
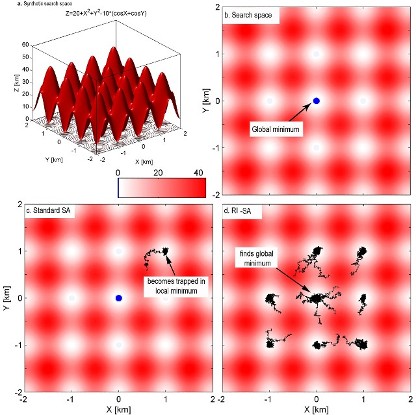
Random search approaches, such as Simulated Annealing (SA) and Genetic Algorithm (GA) are investigated and utilized in an iterated manner. The iterated approach helps to prevent GA in general and SA in particular from getting trapped in local minima, and it also increases redundancy for exploring the search space. A statistical competency test is applied for estimating the confidence interval of the inversion source parameters, considering their internal interaction through model, the effect of the model deficiency, as well as the observational error. [Shirzaei & Walter 2009 JGR] |
 |
A new approach for time-dependent, nonlinear
inversion using a combination of a Genetic Algorithm (GA) and Kalman Filter (KF) is developed.
The GA is used in the form presented by Shirzaei
and Walter, [2009] and KF implementation
now allows for the treatment of monitoring data as a full time series, rather
than as single time steps. This approach provides a flexible tool for assessing
unevenly sampled and heterogeneous time series data and explains the
deformation field using time-consistent dislocation sources. [Shirzaei & Walter 2010 JGR]
|
|
|
The detection and monitoring of gravity-driven
volcano deformation is vital for understanding volcanic hazards, such as
landslides, lateral blasts and debris avalanches. Although deformation has been
detected at several large active volcanoes (e.g., Mt.
Etna, Vesuvius, Kilauea),
these systems also exhibit persistent magmatic activity, obscuring the
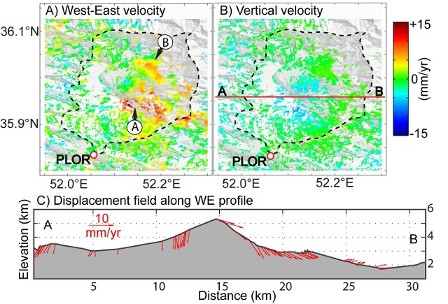
gravity-driven signals of ground motion. In this study, we present a first
InSAR deformation time series at the dormant Damavand volcano in northern Iran, over the
period of 2003 through 2008. The high resolution data show a lateral extension
of the volcano at the relative rate of up to ~6 mm/yr accompanied by a
subsidence at the rate of up to ~5 mm/yr at the volcano summit. [Shirzaei et al. 2011 Geology]
|
|
|
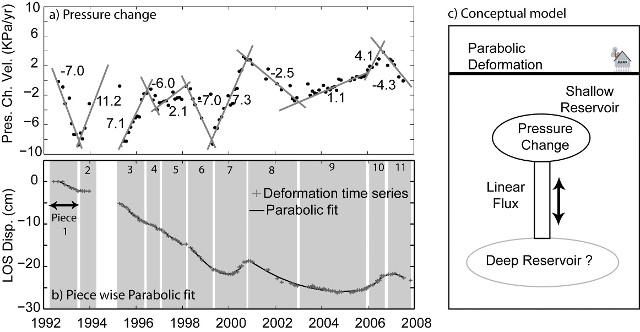
A time-dependent source
modeling technique is applied to InSAR data available between 1992 and 2008 from the Campi Flegrei
volcano in Italy. Multiple episodes of linear velocity for reservoir pressure change is found
associated with parabolic surface deformation at the volcano. This may be
interpreted via differential equations as a linear flux to the shallow
reservoir and provides new insight into how both the shallow and deep
reservoirs communicate beneath Campi Flegrei. [Shirzaei & Walter 2010 JGR]
|
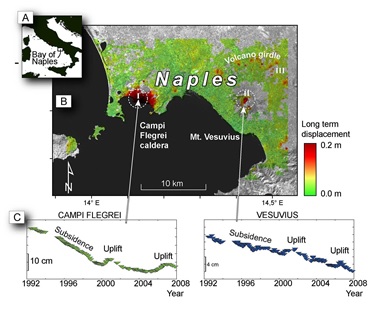 |
We show that during the 16-year
records from 1992-2008, identified episodes of deformation occur
that are in correlation. Albeit differences in the quantity of
deformation, the sign, frequency and rate of pressure changes at
reservoirs beneath Campi Flegrei and Vesuvius can be very similar,
allowing to infer that pressure changes originating from a magmatic or
tectonic source external to the shallow volcano magma plumbing systems
is a likely cause. Such a fluidmechanical coupling sheds light on
earlier episodes of correlated eruptions and deformations occurring
during the historical roman times. [Walter et al. 2014 JVGR]
|
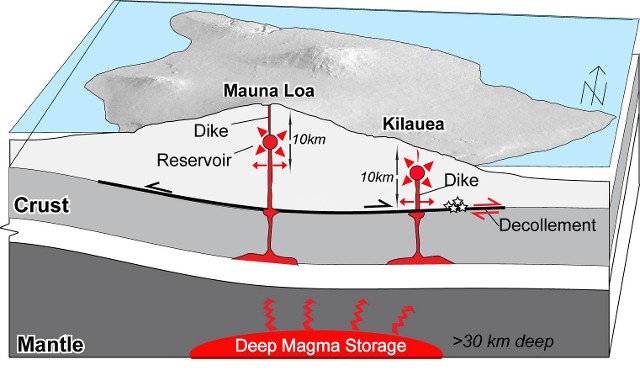 |
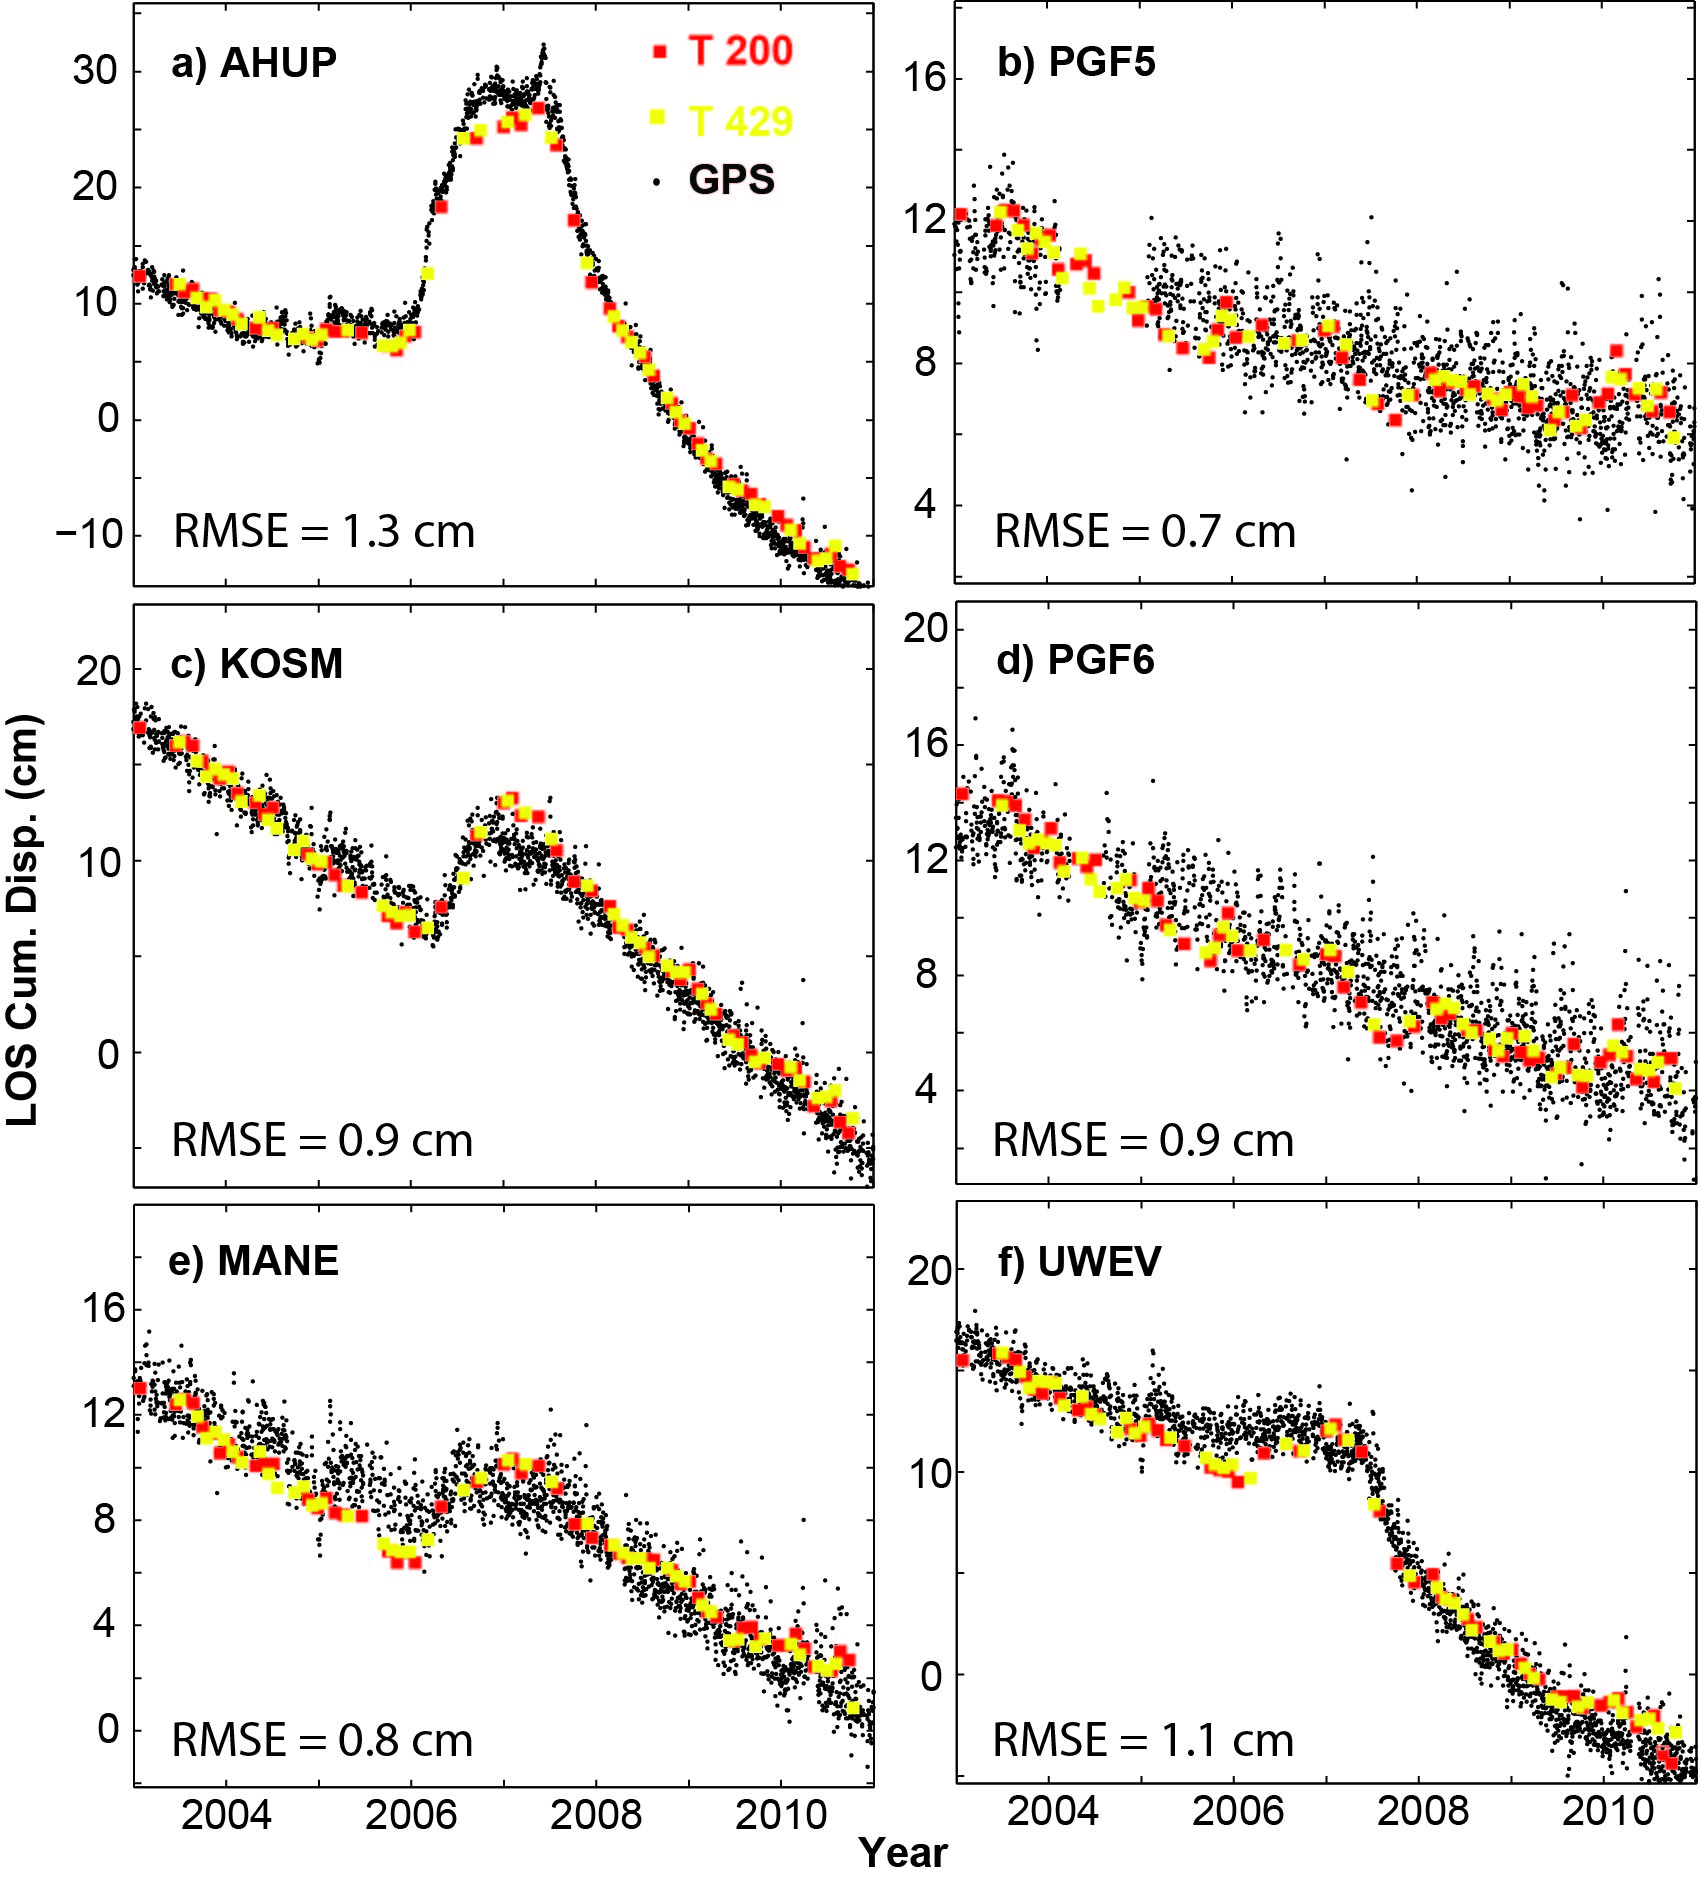
The coupling of Mauna Loa and Kilauea volcanoes,
Hawaii, has been debated for the past 100 years. The distinct
composition of erupted materials at both volcanoes suggests that they draw on
distinct magma reservoir in the mantle. In contrast,
statistical analysis of the pattern of historic eruptions implies that Mauna
Loa and Kilauea compete for magma supply. Resolving this discrepancy, we present high-resolution
spatiotemporal interferometric deformation maps using a well-populated
catalogue of space-borne synthetic aperture radar data over Hawaii
Island during 2003-2008. [Shirzaei et al 2013 GRL]
|
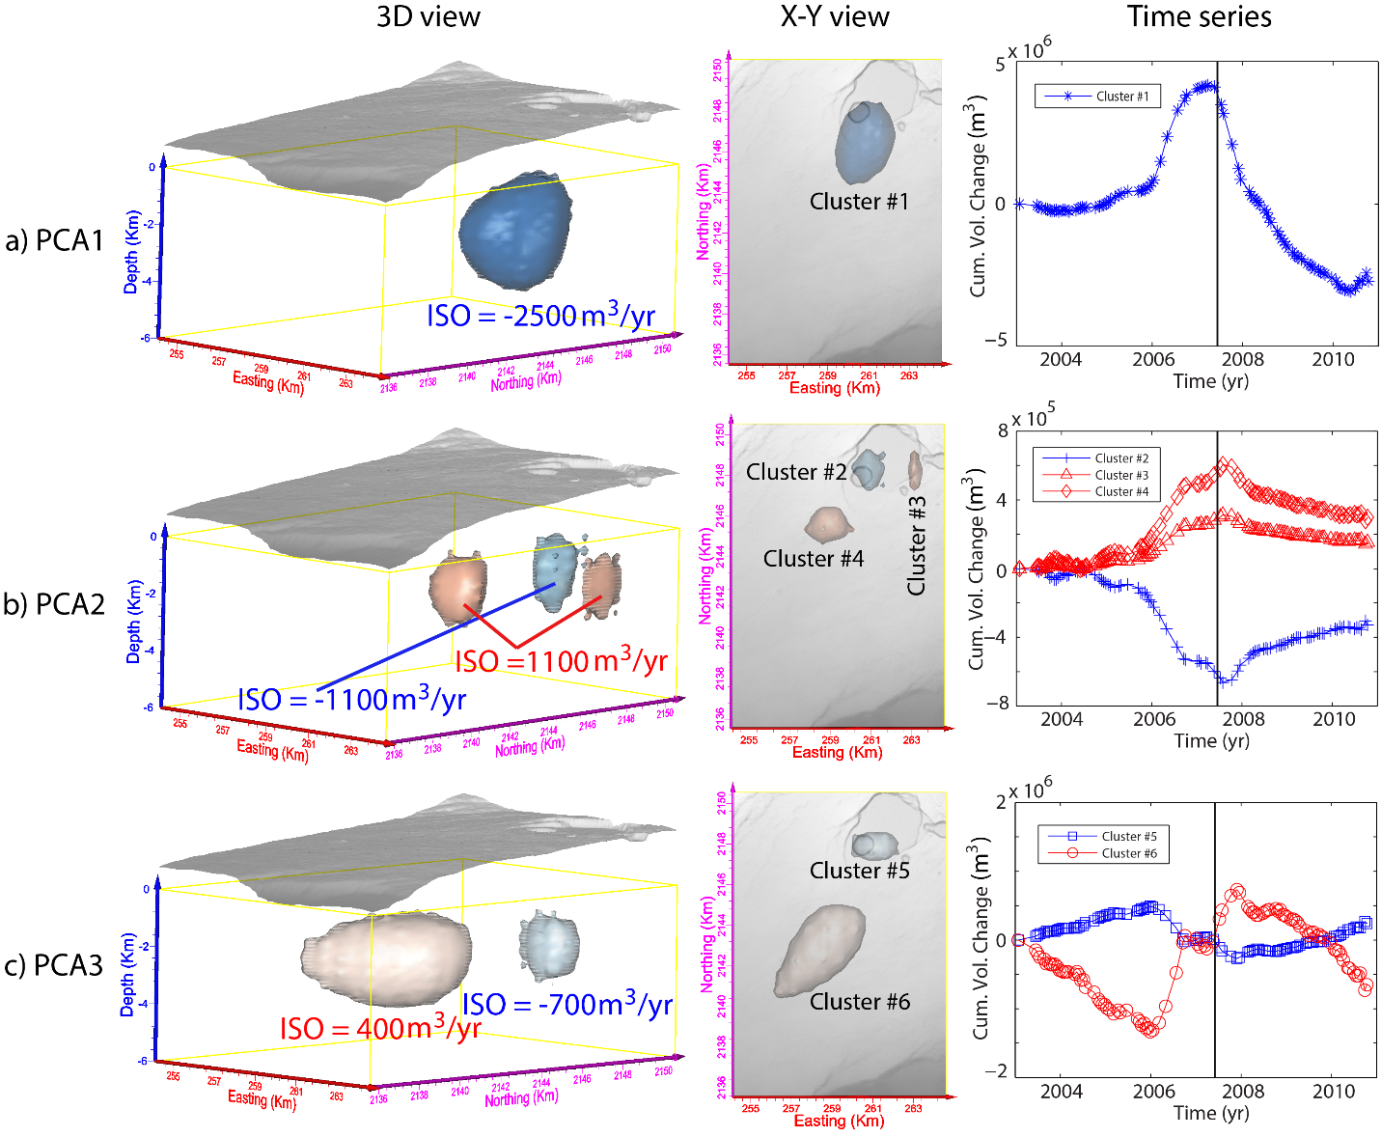 |
To explore the complex geometry and kinematics of the summit reservoir, a novel geometry-free time-dependent modeling scheme is applied to InSAR deformation time series at the Kilauea volcano. The optimum model is characterized by a spheroidal and a tube-like zone of volume change beneath summit and the southwest rift zone at 2-3 km depth, respectively. To reduce the model dimension, we apply a Principal Component Analysis (PCA) scheme, which allows for the identification of independent reservoirs. The first 3 PCs, explaining 99% (63.8%, 28.5%, and 6.6%, respectively) of the model, include six independent reservoirs with a complex interaction suggested by temporal analysis. [Zhai & Shirzaei 2016 JGR] |
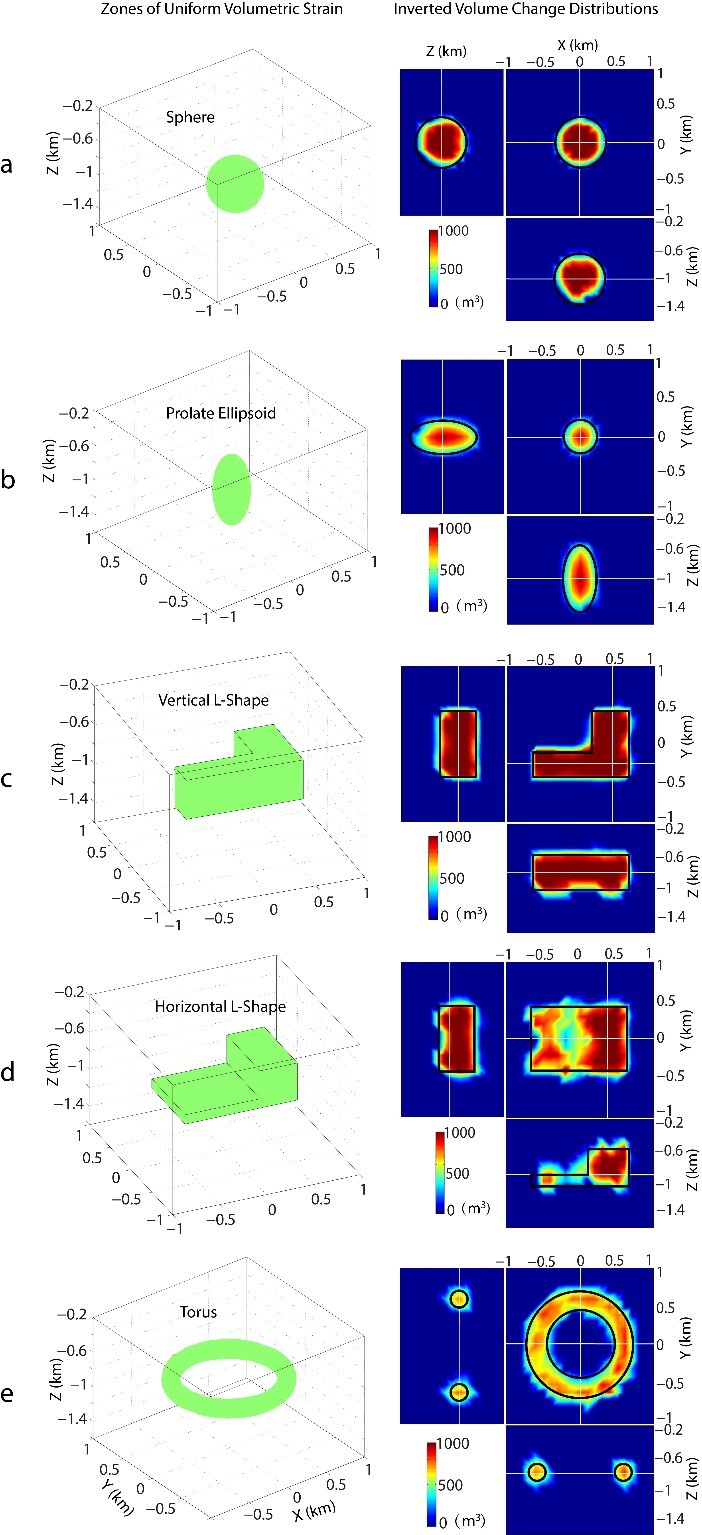 |
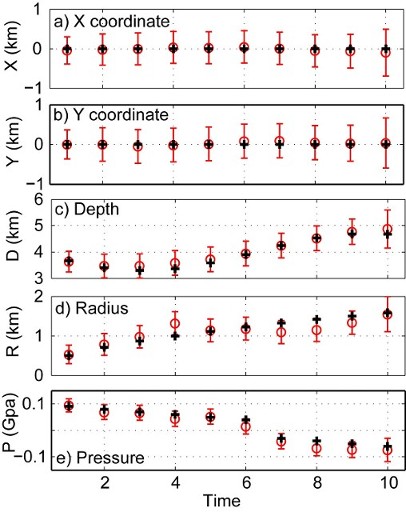
Geodetic
observations of surface deformation associated with volcanic activities can be
used to constrain volcanic source parameters and their kinematics. Simple
analytical models, such as point and spherical sources, are widely used to
model deformation data. The inherent nature of oversimplified model geometries makes
them unable to explain fine details of surface deformation. Current
non-parametric, geometry-free inversion approaches resolve the distributed
volume change, assuming it varies smoothly in space, which may detect
artificial volume change outside magmatic source regions. To obtain a
physically meaningful representation of an irregular volcanic source, we devise
a new sparsity-promoting modeling scheme assuming active magma bodies are
well-localized melt accumulations, namely outliers in the background crust.
First, surface deformation data are inverted using a hybrid L1- and L2-norm regularization
scheme to solve for sparse volume change distributions. Next, a boundary
element method is implemented to solve for the displacement discontinuity
distribution of the reservoir, which satisfies a uniform pressure boundary
condition. The inversion approach is thoroughly validated using benchmark and
synthetic tests, of which the results show that source dimension, depth, and
shape can be recovered appropriately. We apply this modeling scheme to
deformation observed at Kilauea summit for periods of uplift and subsidence
leading to and following the 2007 Father’s Day event. We find that the magmatic
source geometries for these periods are statistically distinct, which may be an
indicator that magma is released from isolated compartments due to large
differential pressure leading to the rift intrusion. [Zhai &
Shirzaei 2017 JGR] |
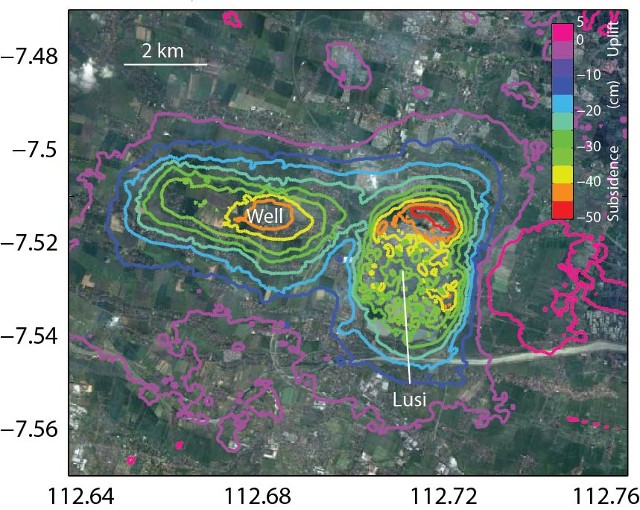 |
The Lusi mud eruption, Indonesia, began in May 2006 and continues to the present. Previous analyses of surface deformation data suggested an exponential decay of the pressure in the mud source, but did not constrain the location, geometry and evolution of the possible source(s) of the erupting mud and fluids. To map the surface deformation, we employ multitemporal InSAR and analyze a well-populated data set acquired by ALOS L-band satellite between May 2006 and April 2011. We then apply a time-dependent inverse modeling scheme. Volume changes occur in two regions beneath Lusi, at 0.3-2.0 km and 3.5-4.75 km depth. The cumulative volume change within the shallow source is ~2-3 times larger than that of the deep source. The observation and model suggest that a shallow source plays a key role by supplying the erupting mud, but that additional fluids do ascend from depths >4 km on eruptive timescales. [Shirzaei et al 2015 GRL] |
 |
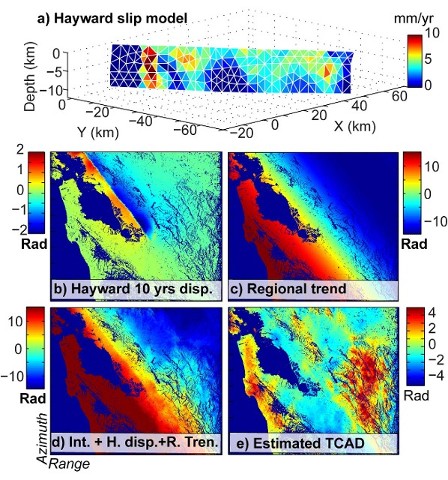
Spatial and temporal variations of aseismic fault creep
represent important factors in realistic estimation of seismic hazard due to
their influence on the size and recurrence interval of large earthquakes along
partially coupled faults. To solve for a time-dependent model of creep on the Hayward
fault, we invert 18 years of surface deformation data (1992 - 2010), obtained
by interferometric processing of 52 and 50 synthetic aperture radar (SAR)
images acquired by the ERS1/2 and ENVISAT satellites, respectively, and surface
creep data obtained at more than 25 alinement and creepmeter stations. [Shirzaei & Burgmann 2013 JGR]
|
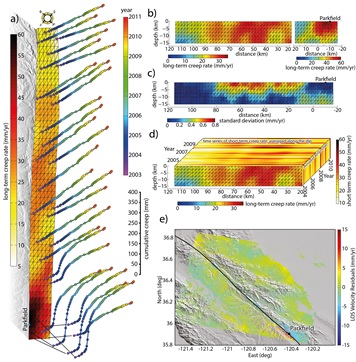 |
The Central segment of San Andreas Fault (CSAF) is characterized by a nearly continuous right-lateral aseismic slip. However, observations of the creep rate obtained using small Characteristically Repeating Earthquakes (CREs) show pulses of creep along the CSAF, which may indicate spatially and temporally variable seismic hazard along the CSAF. Hre, we apply a time-dependent creep modeling approach, which combines InSAR surface deformation time series and observations of fault creep obtained from CREs. The resulting creep rate distribution implies a peak rate up to 32 mm/yr along the central part of the CSAF. Afterslip due to the 2004 Parkfield earthquake on the southeastern segment of the CSAF is also manifest in the model and there is clear evidence of creep pulsing along the strike and depth of the CSAF. The estimated annual rate of slip deficit accumulation is equivalent to a magnitude 5.6-5.7 earthquake. [Khoshmanesh et al. 2015 JGR] |
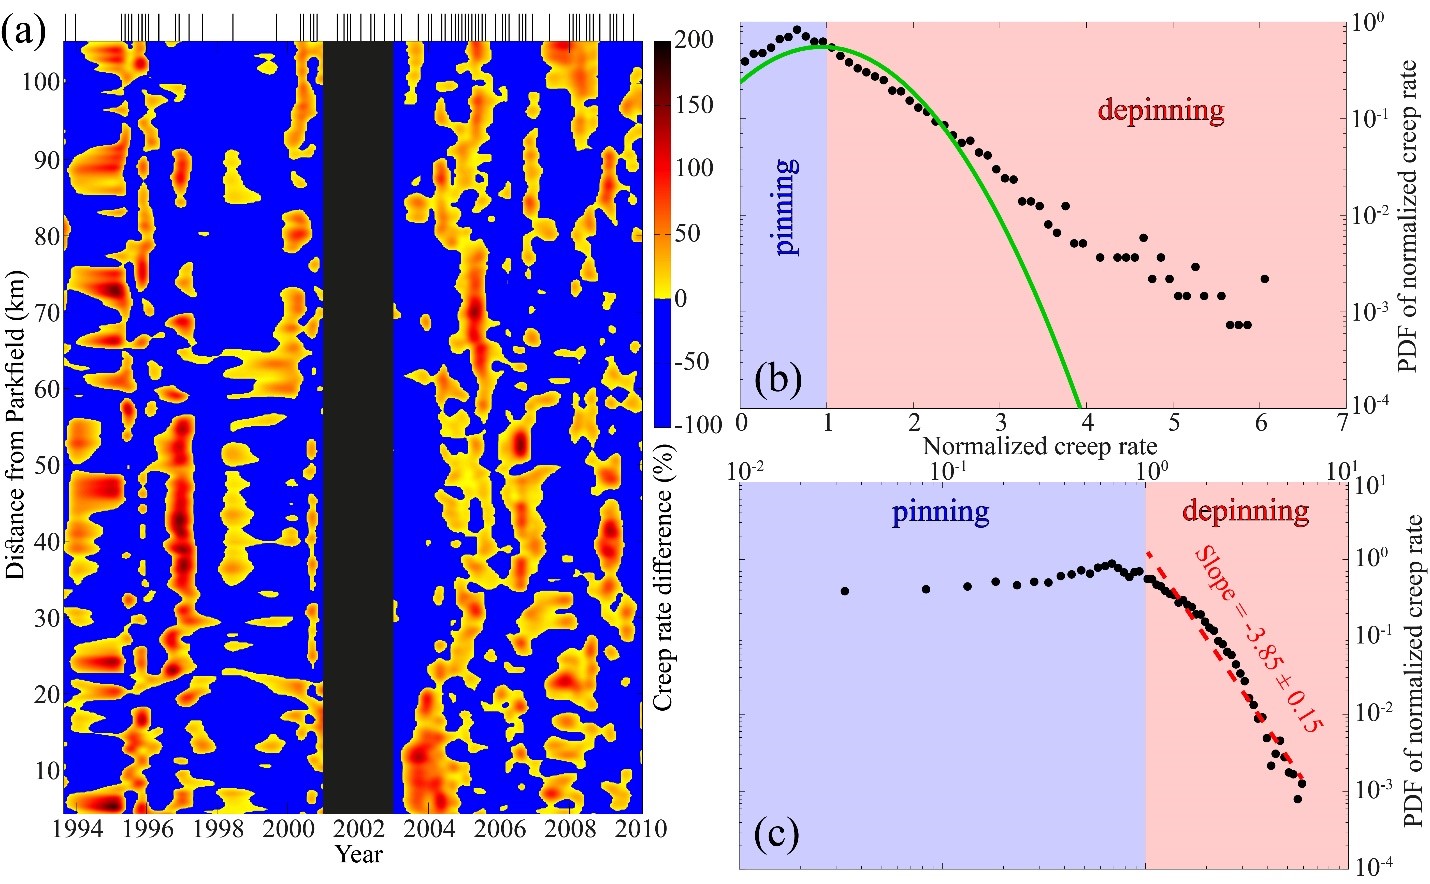 |
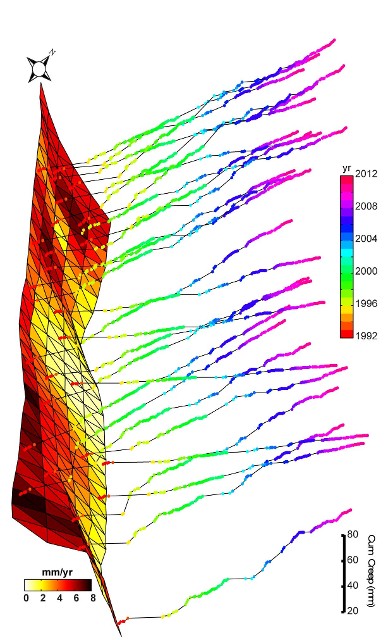
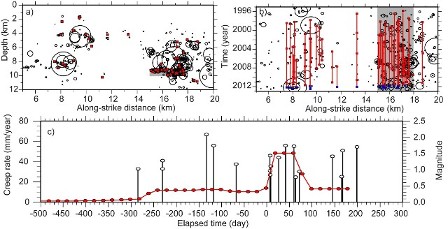
Understanding the evolution of aseismic slip enables
constraining the fault seismic budget and provides insight into dynamics of
creep. Inverting the time series of surface deformation measured along the
Central San Andreas Fault obtained from Interferometric Synthetic Aperture
Radar in combination with measurements of repeating earthquakes, we constrain
the spatiotemporal distribution of creep during 1992-2010. We identify a new
class of intermediate-term creep rate variations that evolve over
decadal-scale, releasing stress on the accelerating zone and loading adjacent
decelerating patches. We further show that in short-term (< 2-year period),
creep avalanches, i.e. isolated clusters of accelerated aseismic slip with
velocities exceeding the long-term rate, govern the dynamics of creep. The
statistical properties of these avalanches suggest existence of elevated pore
pressure in the fault zone, consistent with laboratory experiments. |
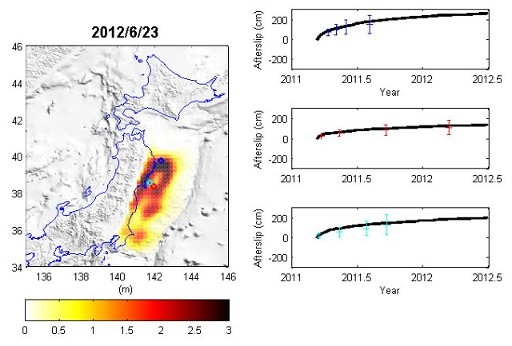 |
Availability of dense continuous GPS and seismic
monitoring networks provides a unique opportunity to study a variety of
time-dependent processes associated with the 11 March 2011 Tohoku earthquake
(Mw 9.0), such as afterslip deformation and postseismic relaxation. To this end
we establish a time-dependent inversion scheme as a combination of L1-Norm
minimization and Kalman filter. This framework allows inverting the time series
of the surface deformation obtained from GPS networks constrained with direct
observations of the fault slip obtained from repeating earthquakes. [Shirzaei et al. 2014 EPSL]
|
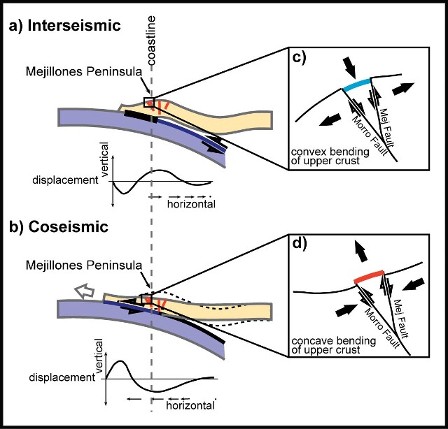 |
We show a rare example of aseismic response of a creeping fault to the earthquake cycle of a nearby megathrust. Interferometric synthetic aperture radar (InSAR) is used to detect and analyze shallow creep of two crustal faults at Mejilones Peninsula, Northern Chile, located in the hanging wall of the 2007 Mw7.7 Tocopilla subduction earthquake. [Shirzaei et al. 2012 EPSL] |
 |
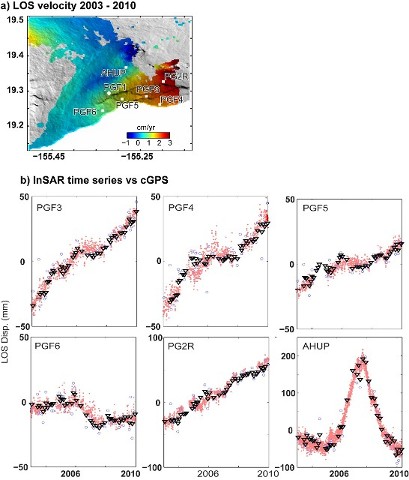
The Hilina Fault System (HFS) is located on the
south flank of Kilauea volcano and is thought to represent the surface
expression of an unstable edifice sector that is active during seismic events
such as the 1975 Kalapana earthquake. Despite its potential for hazardous landsliding
and associated tsunamis, no fault activity has yet been detected by means of
modern geodetic methods since the 1975 earthquake. Using wavelet transforms in a
statistical framework, we jointly analyze InSAR and continuous GPS deformation data
from 2003 to 2010 to resolve a subtle deformation signal about the HFS normal
fault scarps. [Shirzaei et al. 2013 EPSL]
|
 |
Models of Himalayan neotectonics generally attribute most active
mountain building in the range to slip on the Himalayan Sole Thrust (HST), which
accommodates underthrusting of the Indian Plate beneath Tibet. However, the
geometry of the HST and thus how slip along it causes uplift of the High Himalaya
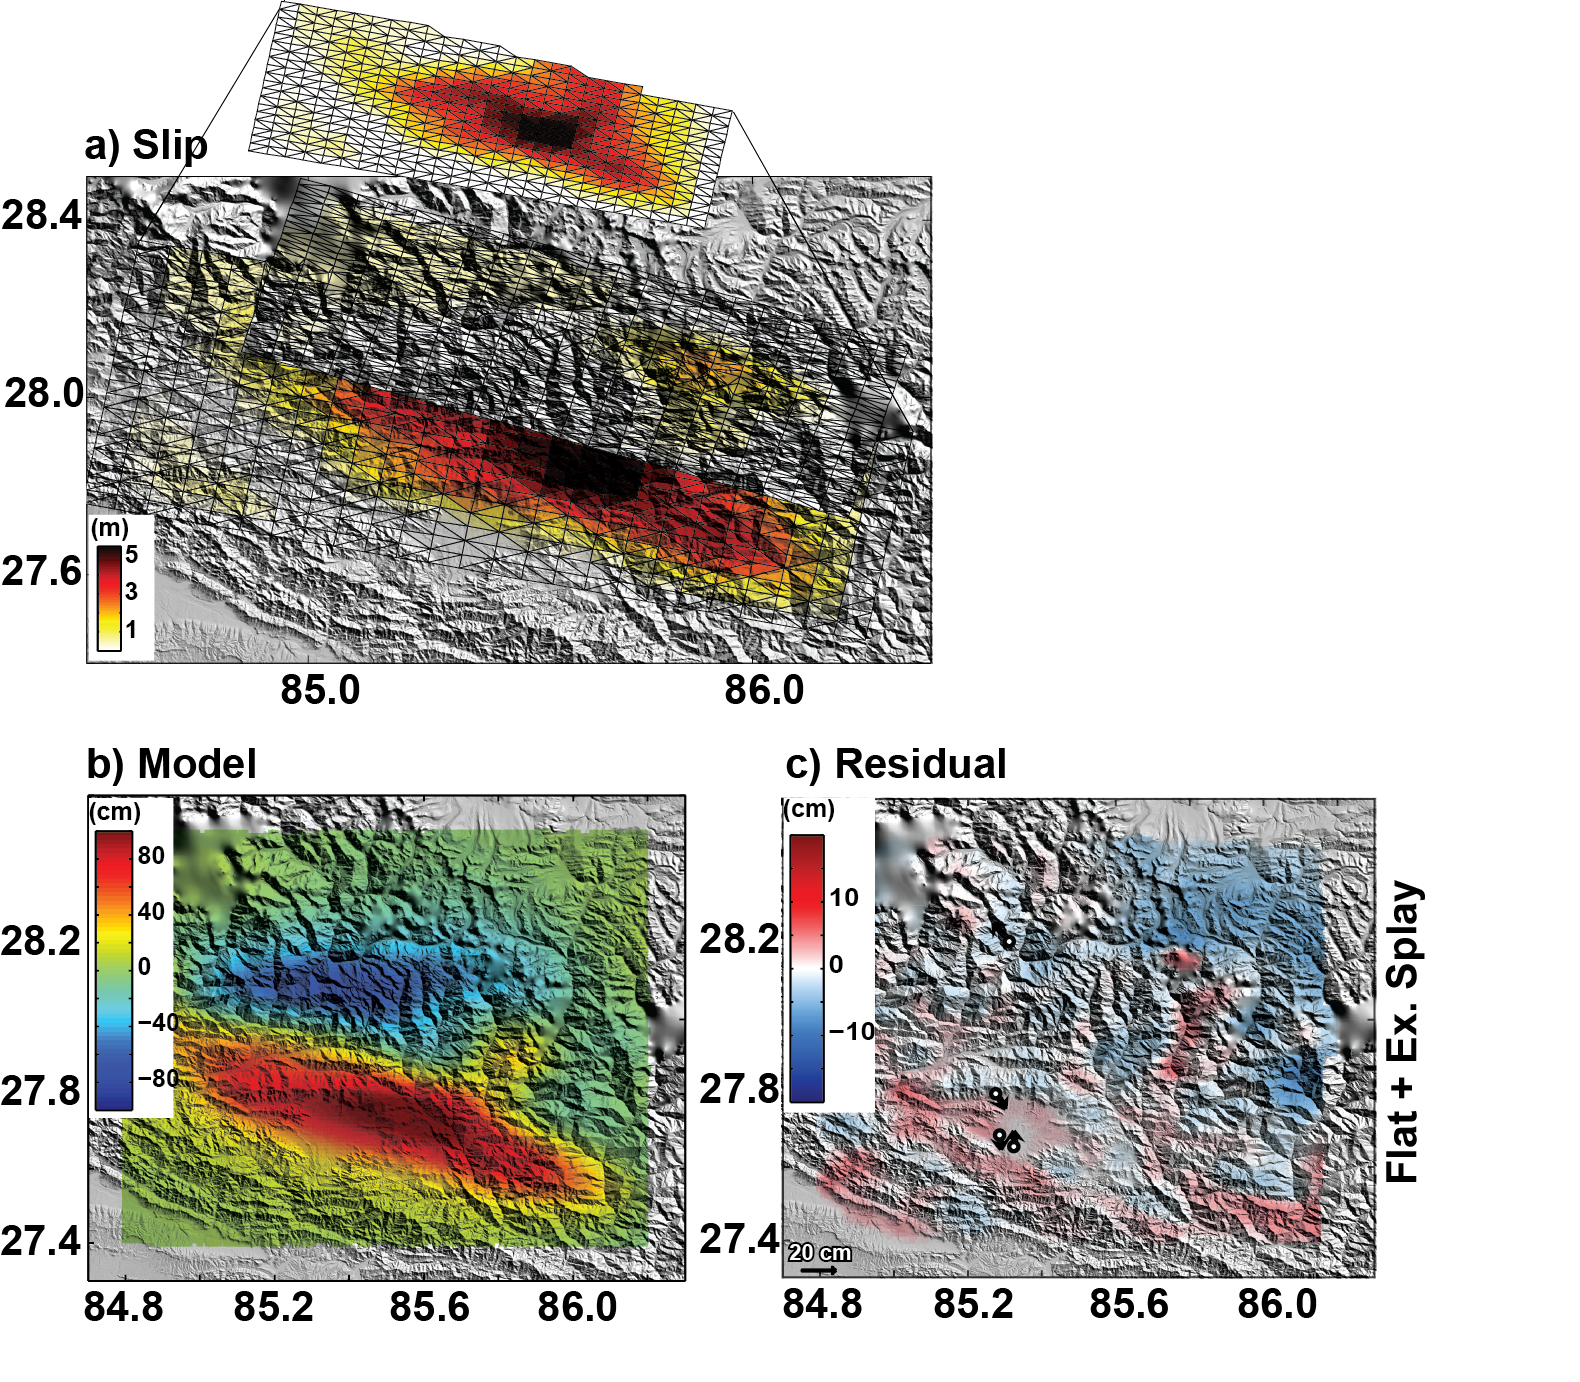
are unclear. We show that the 2015 Gorkha earthquake sequence adds important
clarity to the architecture of the HST, suggesting that the canonical view of
how the Himalaya grow may require revision. Inversion of surface deformation
patterns for the event, as revealed by InSAR and GPS data, implies that the HST
extends as a planar gently-dipping fault surface from near the Himalayan thrust
front northward for at least 100 km, well north of the main physiographic
transition demarcating the southern flank of the High Himalaya, implying that building
of the high range cannot be attributed solely to slip along HST over a steep
ramp, as has commonly been inferred. [Whipple et al. 2016 NGeo] |
|
|
The probability of large
seismic events on a particular fault segment may vary due to external
stress
changes imparted by nearby deformation events, including other
earthquakes and
aseismic processes, such as fault creep and postseismic relaxation. We
use surface deformation data to investigate the kinematics of
fault creep on the northern HF and its relation to two seismic clusters
in October 2011 and March 2012, and an Mw4.2
event in July 2007. We
estimate that the 1-day probability of a large event on the HF only
increased
by up to 0.18% and 0.05% due to the static stress increase and
stressing rate
change by the 2011 and 2012 clusters. For the July 2007 south Oakland
event (Mw4.2)
the estimated increase of short-term probabilities is 50%, highlighting
the
importance of short-term probability changes due to transient stress
changes. [Shirzaei et al. 2013 EPSL]
|
|
|
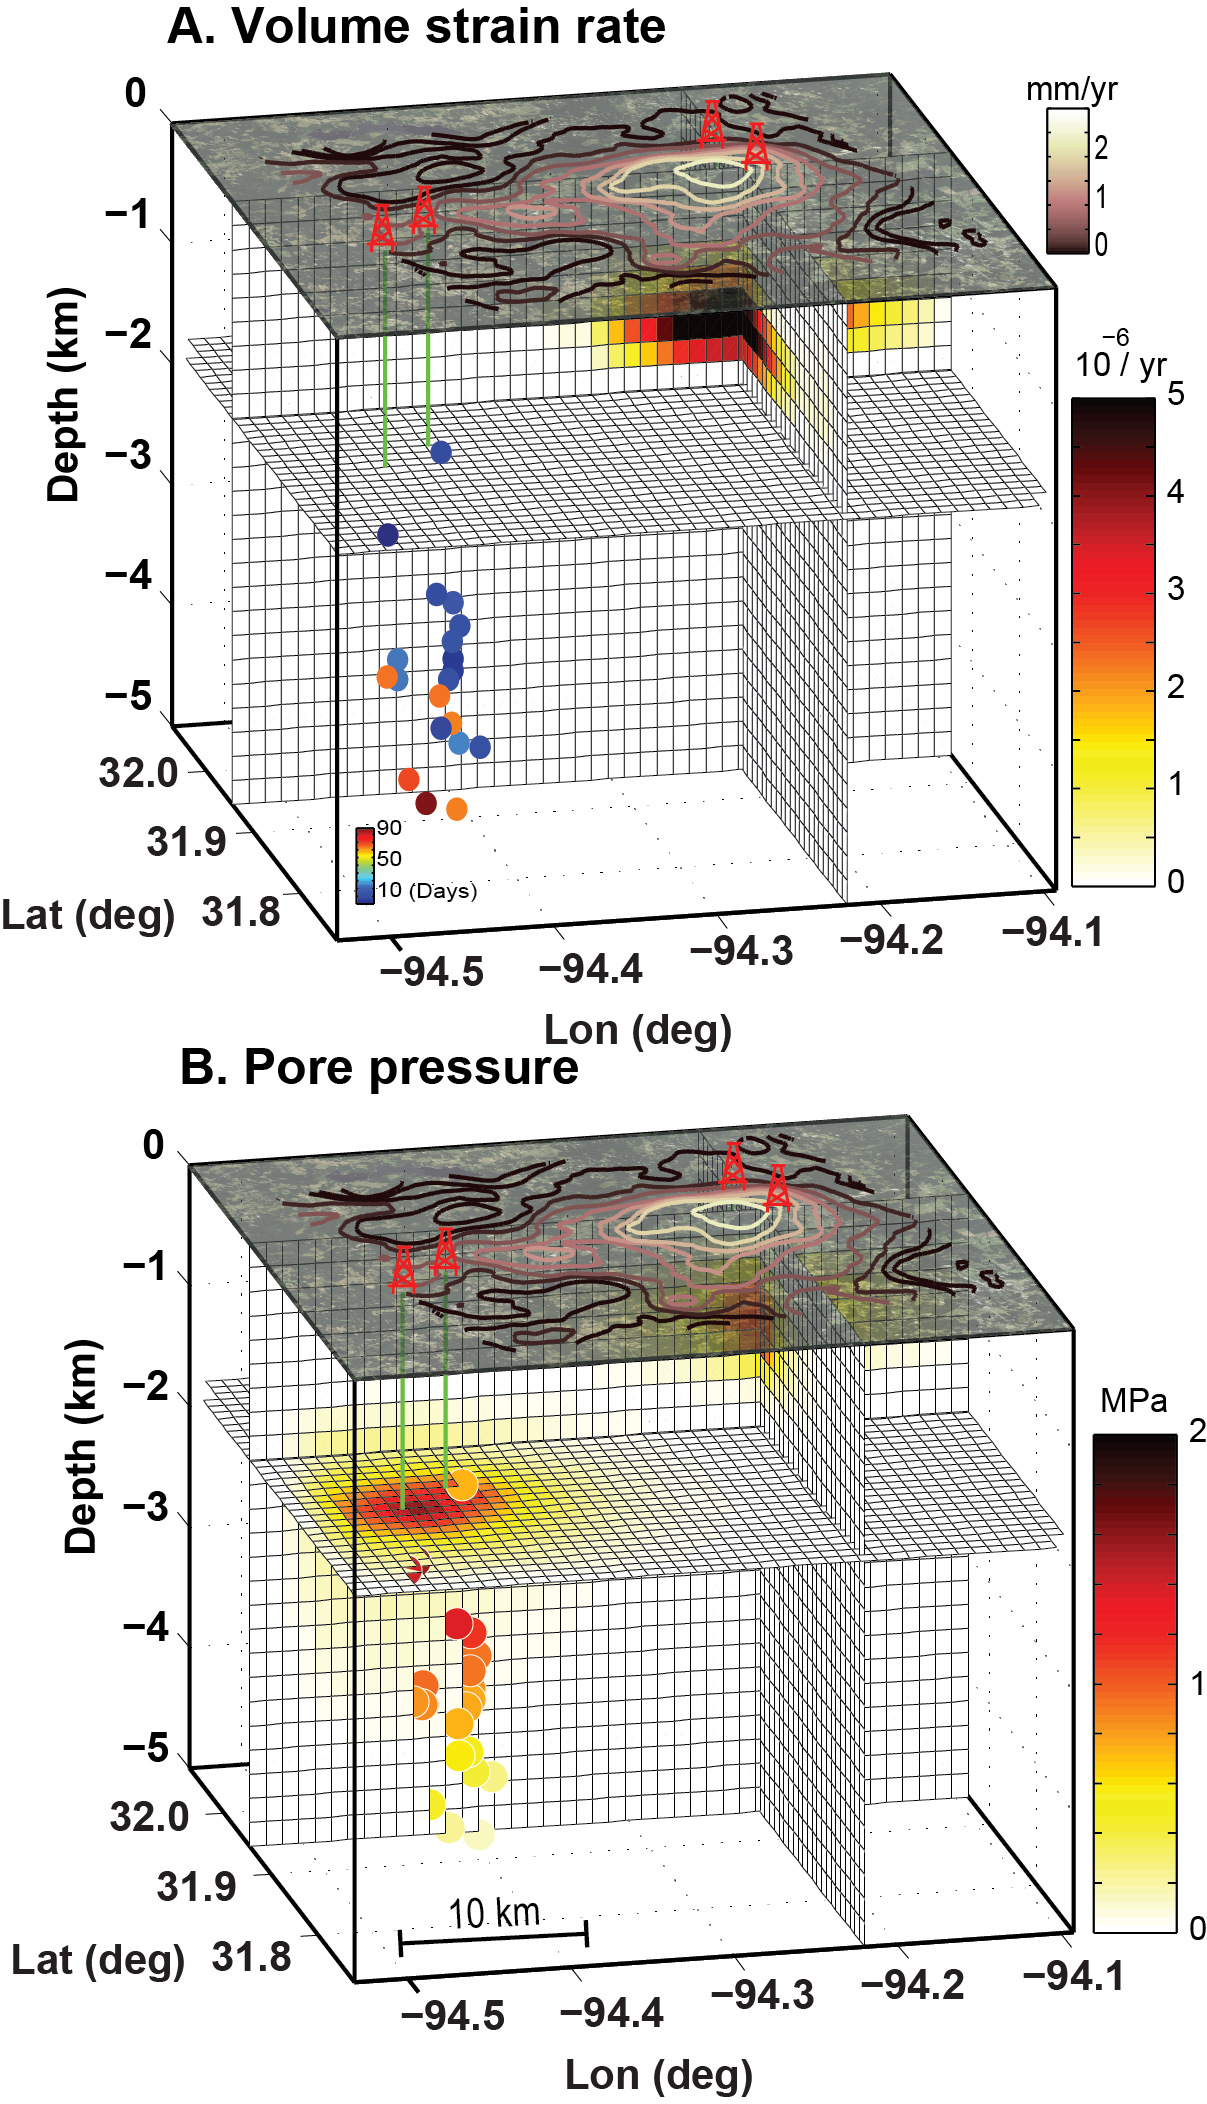
Observations that unequivocally link seismicity and
wastewater injection are scarce. Here we show that wastewater injection in
eastern Texas causes uplift, detectable using radar interferometric data to
> 8 km from the wells. Using measured uplift, reported injection data, and a
poroelastic model, we compute the crustal strain and pore pressure. We infer
that a > 1 MPa increase in pore pressure in rocks with low compressibility
triggers earthquakes including the Mw4.8, 17 May 2012 event, the
largest earthquake recorded in east Texas. Seismic activity increased even
while injection rates declined owing to diffusion of pore pressure from earlier
periods with higher injection rates. Induced seismicity potential is suppressed
where tight confining formations prevent pore pressure from propagating into
crystalline basement rocks. [Shirzaei et al. 2016 Science]
|
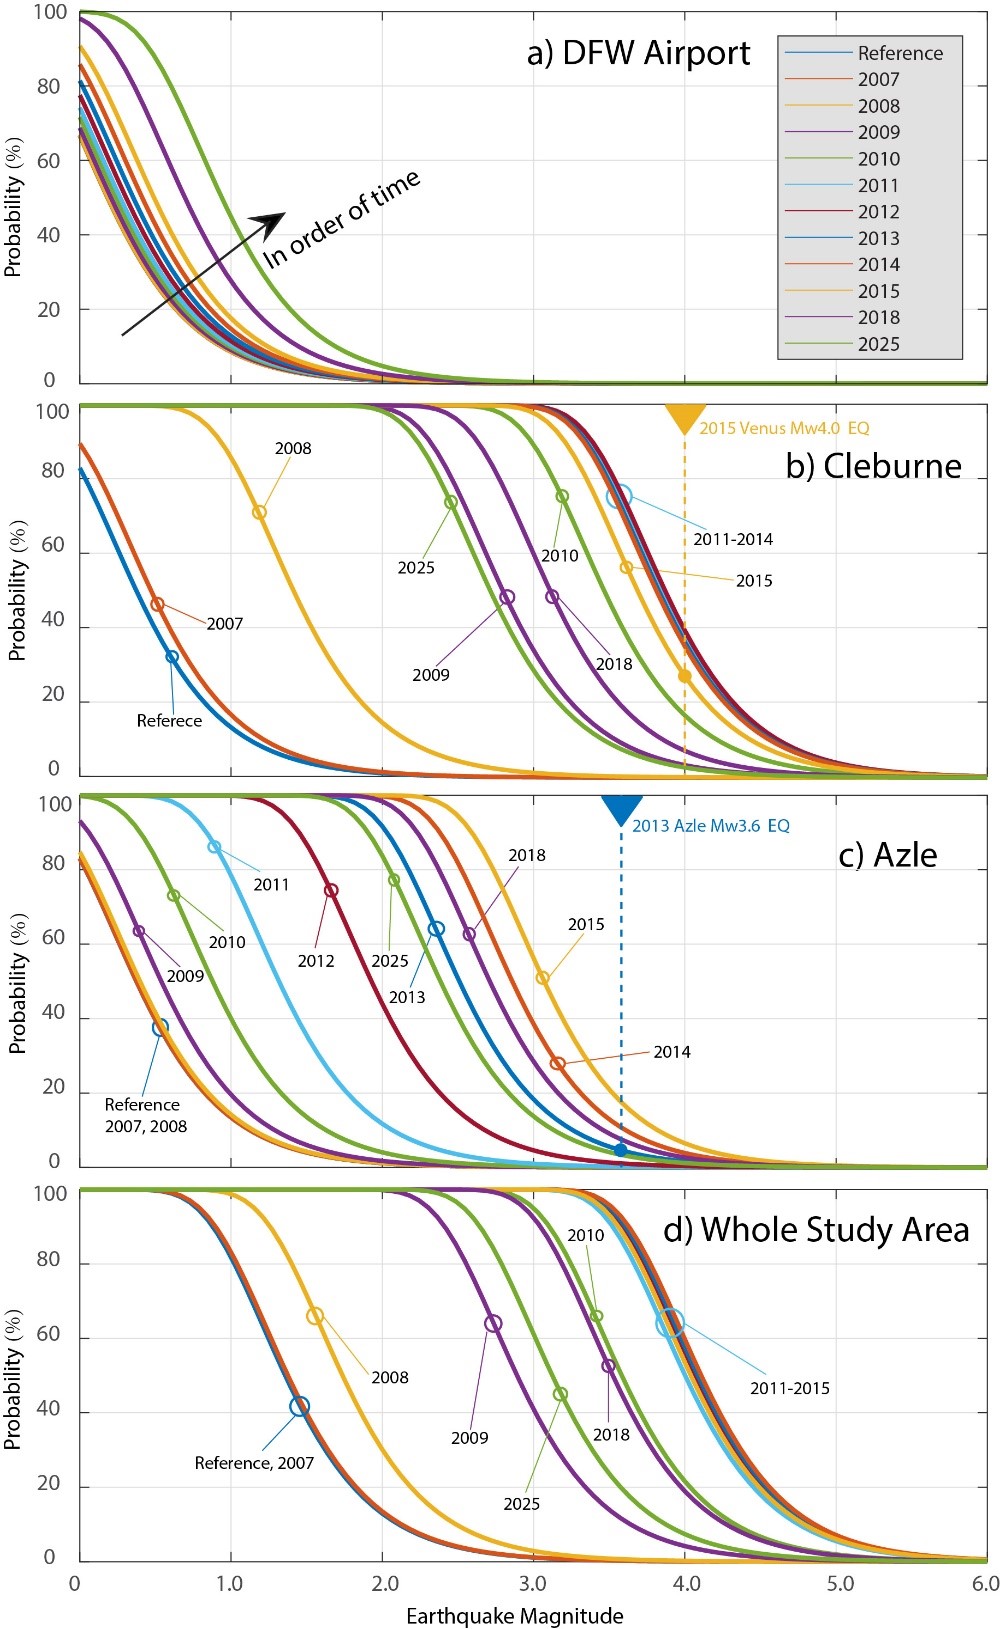 |
The Barnett Shale in Texas experienced an increase in seismicity since 2008, coinciding with high-volume deep fluid injection. Despite the spatialfirst-order correlation between seismic records and the total volume of injected fluid requires more comprehensive geomechanical analysis, which accounts for local hydrogeology. Using time-varying injections at 96 wells and employing a coupled linear poroelastic model, we simulate the spatiotemporal evolution of pore pressure and poroelastic stresses during 2007-2015. The overall contribution of poroelastic stresses to CFS (Coulomb failure stress) change is ~10% of that of pore pressure, however, both can explain the spatiotemporal distribution of earthquakes. We use a seismicity rate model to calculate earthquake magnitude exceedance probability due to stress changes. The obtained time-dependent seismic hazard is heterogeneous in space and time. Decreasing injection rates does not necessarily reduce probabilities immediately. [Zhai and Shirzaei 2018 GRL] proximity, the lack of a |
|
|
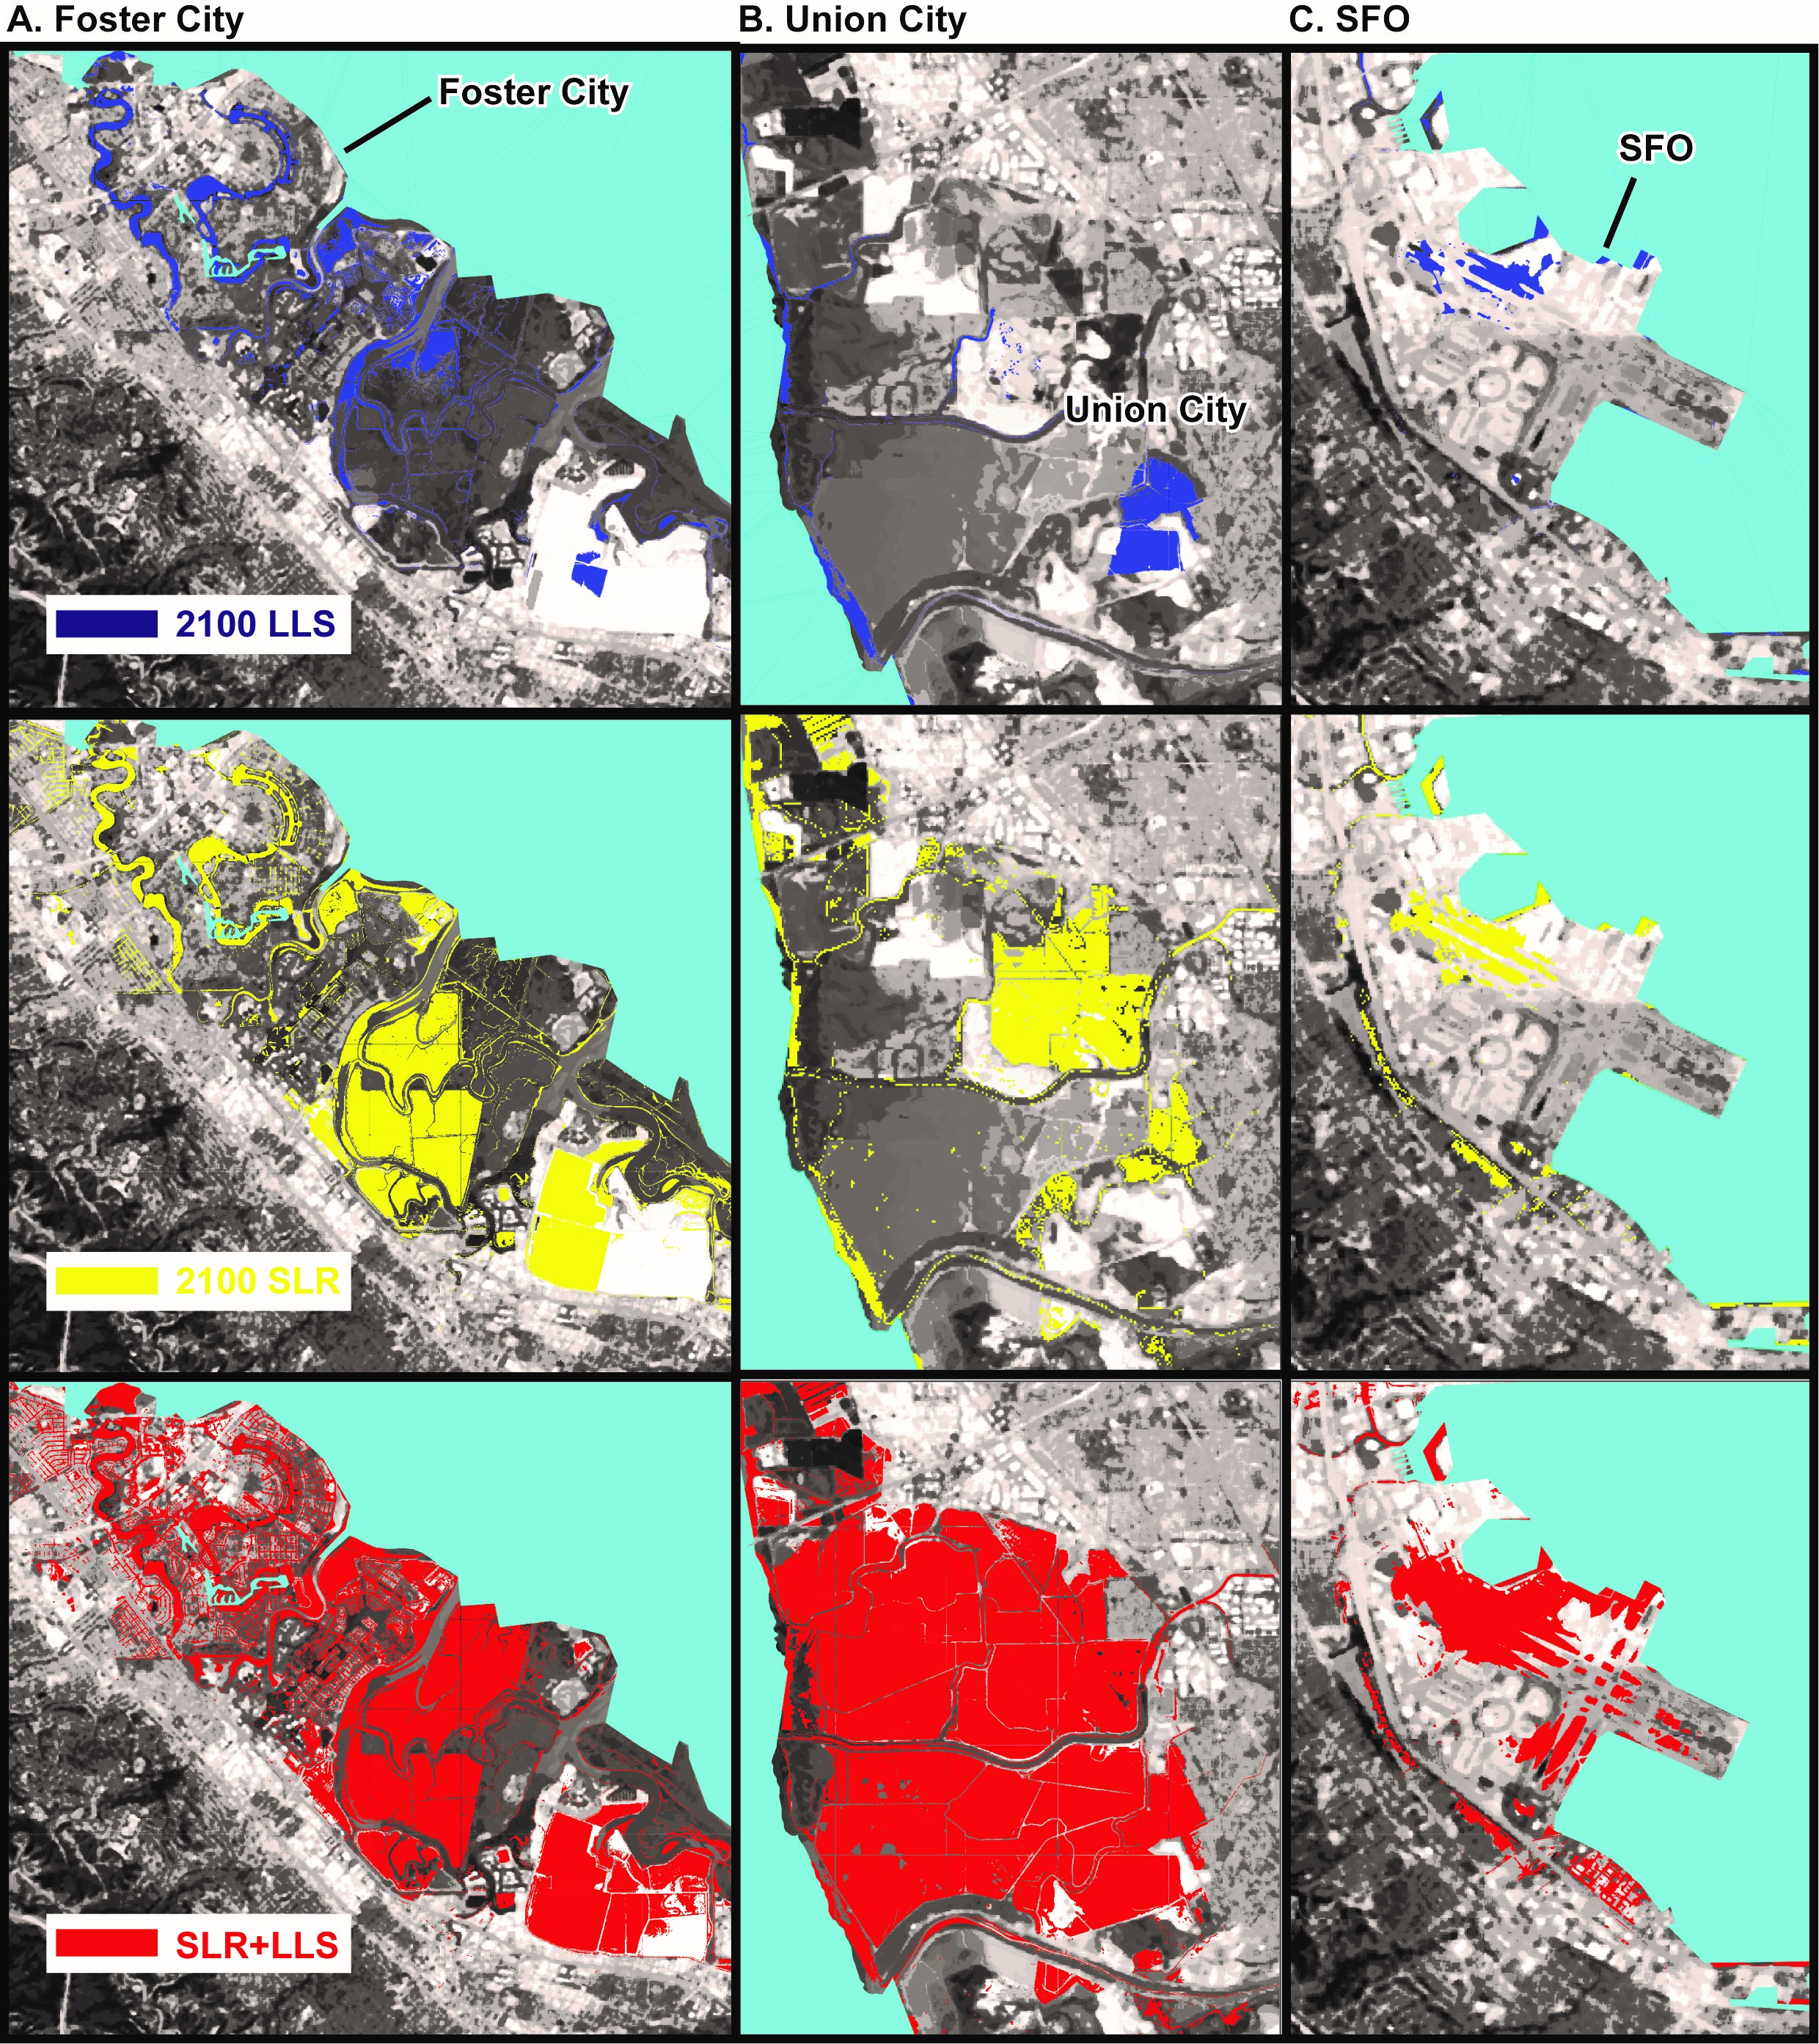
The current global projections of future sea level rise are the basis
for developing inundation hazard maps. However, contributions from spatially
variable coastal subsidence have generally not been considered in these projections.
Here, we use SAR interferometric measurements and GNSS data to show subsidence
rates of less than 2 mm/yr along the majority of coastal areas along San
Francisco Bay. However, rates exceed 10 mm/yr in some areas underlain by
compacting artificial landfill and Holocene mud deposits. The maps estimating
100-year inundation hazards solely based on the projection of sea level rise from
various emission scenarios underestimate the area at risk of flooding by 3.7% -
90.9%, compared with revised maps that account for the contribution of local
land subsidence. Given ongoing land subsidence, we project that an area of 125
km2 – 429 km2 will be vulnerable to inundation, as
opposed to 51 km2 – 413 km2 considering sea level rise
alone. [Shirzaei & Burgmann 2018 Science Ad.]
|
|
|
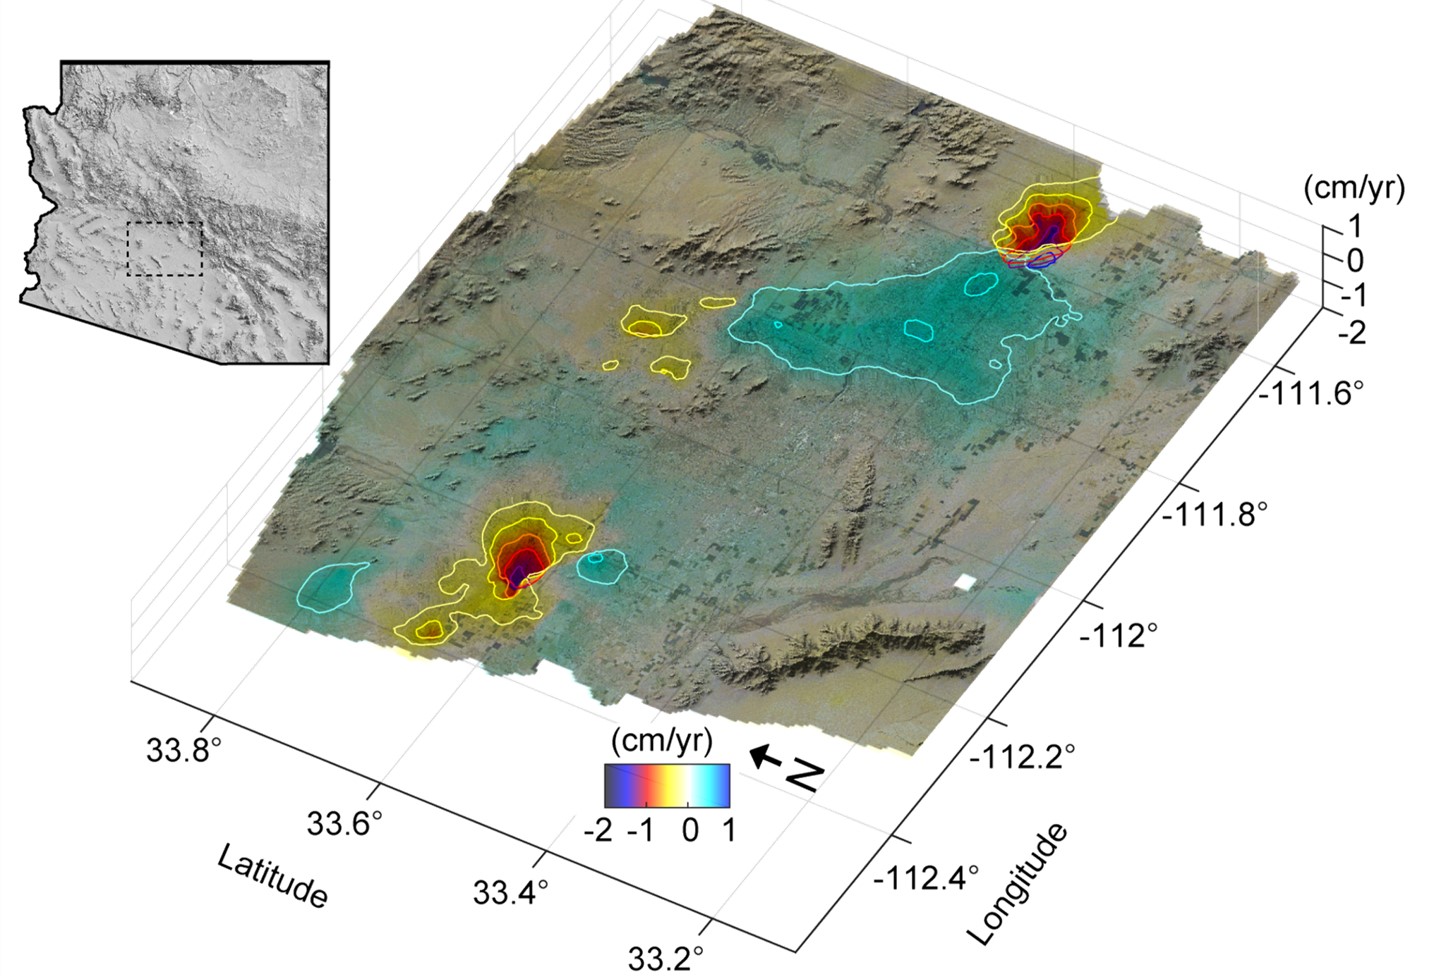
The effects of land subsidence pose a
significant hazard to the environment and infrastructure in the arid, alluvial
basins of Phoenix, Arizona. Improving our understanding of the source and
mechanisms of subsidence is important for planning and risk management. Here,
we employ multitemporal interferometric analysis of large SAR datasets acquired
by ERS and Envisat satellites to investigate ground deformation. The ERS datasets
from 1992-1996 and Envisat, 2003-2010, are used to generate LOS time series and
velocities in both the ascending and descending tracks. The general deformation
pattern is consistent among datasets and is characterized by three zones of
subsidence and a broad zone of uplift. The multi-track Envisat LOS time series
of surface deformation are inverted to obtain spatiotemporal maps of the
vertical and horizontal deformation fields. We use observation wells to provide
an in situ, independent dataset of hydraulic head levels. Then we analyze
vertical InSAR and hydraulic head level time series using continuous wavelet
transform to separate periodic signal components and the long-term trend. The isolated
signal components are used to estimate the elastic storage coefficient, the inelastic skeletal storage coefficient, and
compaction time constants. Together
these parameters describe the storage response of an aquifer system to changes
in hydraulic head and surface elevation. Understanding aquifer parameters is useful for
the ongoing management of groundwater resources. [Miller & Shirzaei 2015 JGR].
|
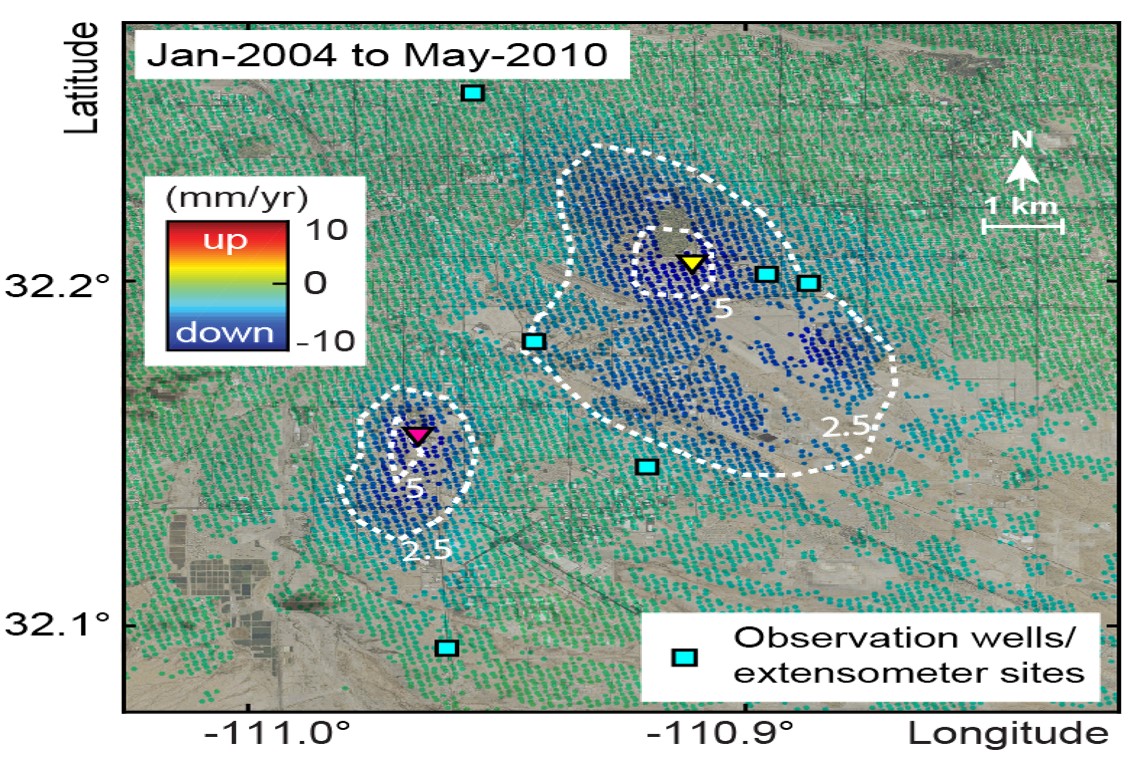 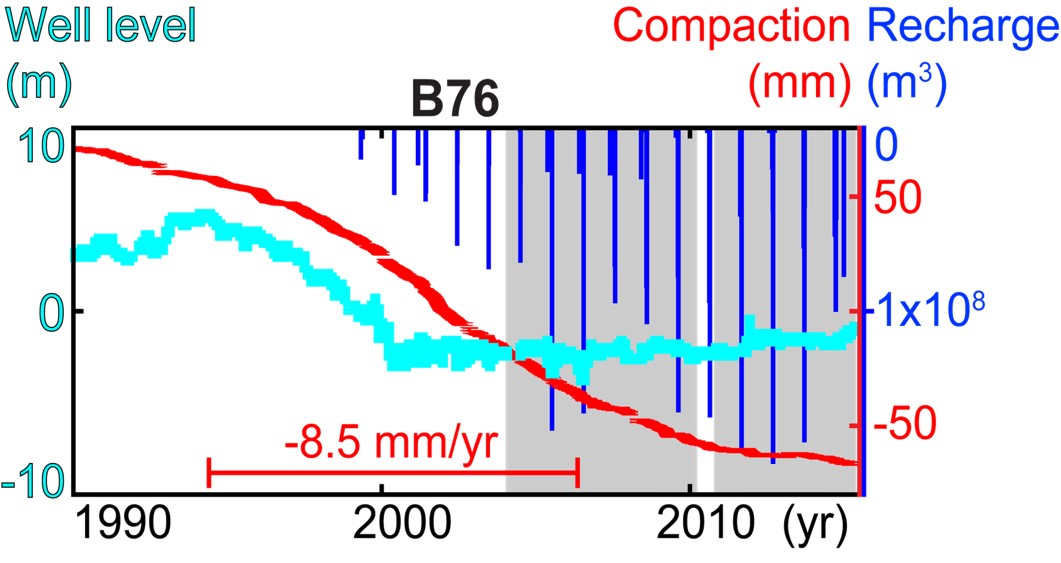 |
In recent decades, high groundwater extraction rates, often
coincident with periods of severe drought, result in the widespread decline of
water levels. Overexploitation of aquifers also causes land subsidence, which
poses a severe threat to infrastructure. Tucson, Arizona experiences land
subsidence coupled with the depletion of groundwater, a critical water resource
for the desert city. To understand the spatiotemporal evolution of land subsidence
and its implications for aquifer properties, we examine long time series of
surface deformation and head levels. Measurements at extensometer stations
indicate rapid compaction of fine-grained material up to 8.5 mm/yr from 1990 to
2005, which results in permanent storage volume losses up to 4.1%. The analysis
of densely populated sets of interferograms generated from Envisat and RadarSAT
C-band acquisitions yields multitemporal maps of surface deformation at
unprecedented resolution. These maps reveal that subsidence significantly slows
by the late 2000s, corresponding with the implementation of artificial recharge
efforts. Subsequent to groundwater level recovery, we observe a brief 6.6-year
interval of residual compaction, suggesting a high vertical hydraulic
conductivity, which is then shown to be up to 9.8x10⁻⁴ m/day. We also estimate
the average elastic and inelastic skeletal storage coefficients for the aquifer
system to be 3.78x10⁻³ and 6.01x10⁻³, respectively. InSAR shows deformation
nearly ceases by 2015, likely reducing hazards associated with earth fissuring
and infrastructure damage. This study highlights successful outcomes of water
management and conservation plans that preserve existing groundwater reserves
and increase artificial recharge. [Miller et al. 2017 JGR]
|
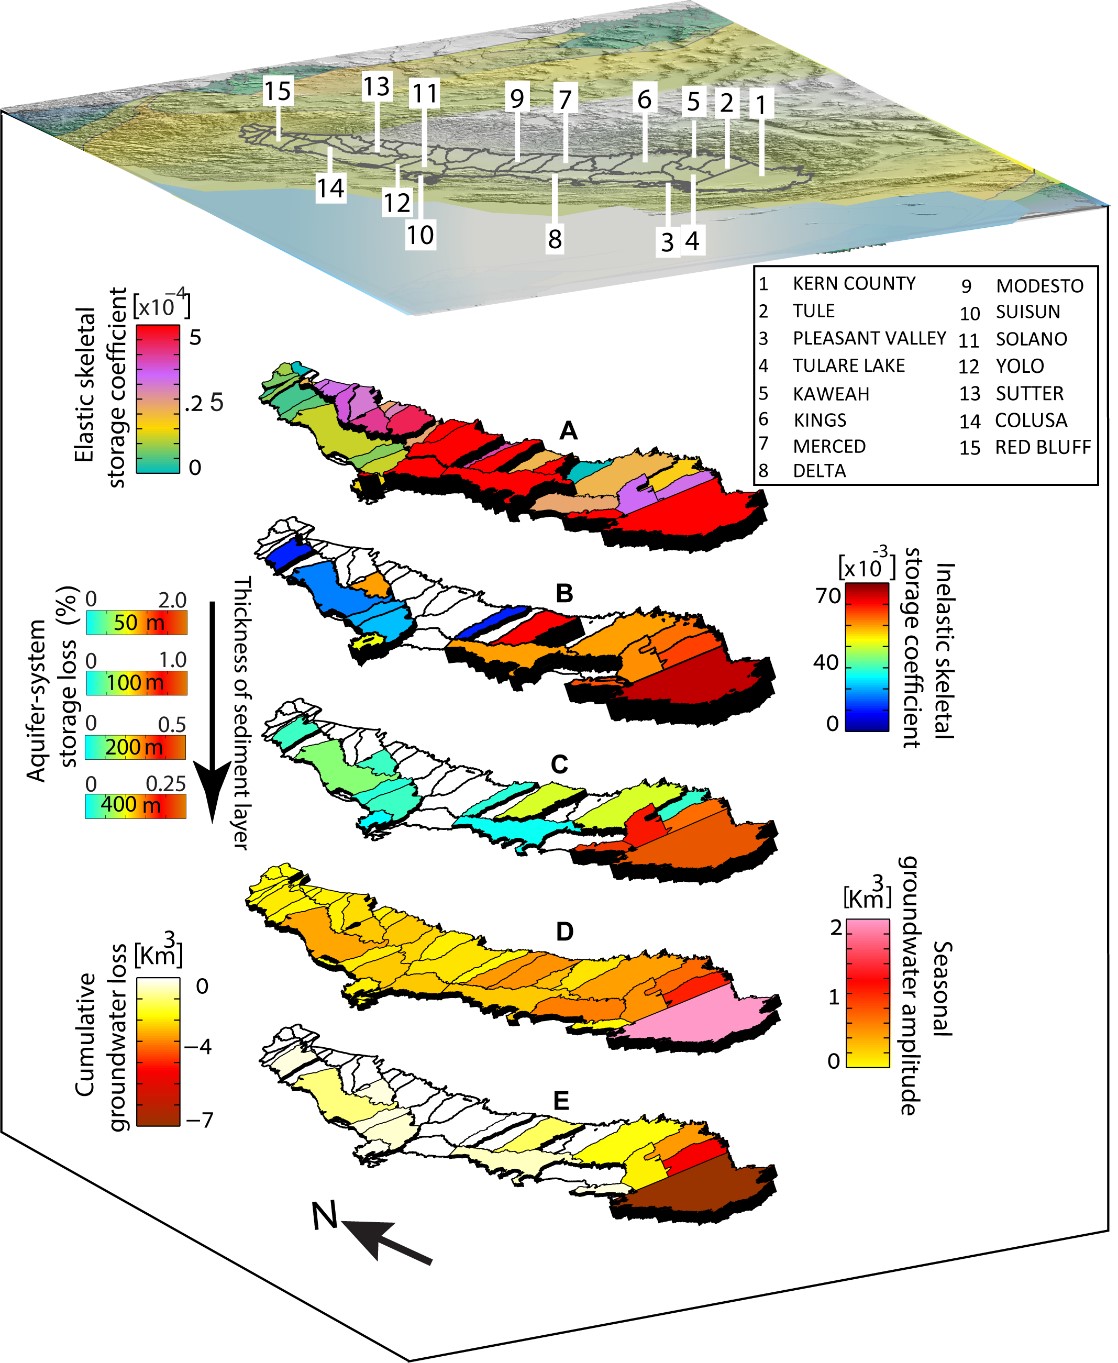 |
The accelerated rate of decline in groundwater levels across
California’s Central Valley results from over-drafting and low rates of natural
recharge and is exacerbated by droughts. The lack of observations with adequate
spatiotemporal resolution to constrain the evolution of groundwater resources
poses serious challenges to water management efforts. Here, we present SAR
interferometric measurements of high-resolution vertical land motion across the
valley, revealing multiscale patterns of aquifer hydrogeological properties and
groundwater storage change. Investigating the depletion and degradation of the
aquifer-system during 2007 – 2010, when the entire valley experienced a severe
drought, we find that ~2% of total aquifer-system storage was permanently lost,
owing to irreversible compaction of the system. Over this period, the seasonal
groundwater storage change amplitude of 10.11 ± 2.5 km3 modulates a long term
groundwater storage decline of 21.32 ± 7.2 km3. Estimates for sub-basins show
more complex patterns, most likely associated with local hydrogeology,
recharge, demand and underground flow. Presented measurements of aquifer-system
compaction provide a more complete understanding of groundwater dynamics and
can potentially be used to improve water security. [Ojha et al. 2018 WRR] |